Walgreens 2014 Annual Report Download - page 93
Download and view the complete annual report
Please find page 93 of the 2014 Walgreens annual report below. You can navigate through the pages in the report by either clicking on the pages listed below, or by using the keyword search tool below to find specific information within the annual report.-
 1
1 -
2
-
3
-
4
-
5
-
6
-
7
-
8
-
9
-
10
-
11
-
12
-
13
-
14
-
15
-
16
-
17
-
18
-
19
-
20
-
21
-
22
-
23
-
24
-
25
-
26
-
27
-
28
-
29
-
30
-
31
-
32
-
33
-
34
-
35
-
36
-
37
-
38
-
39
-
40
-
41
-
42
-
43
-
44
-
45
-
46
-
47
-
48
-
49
-
50
-
51
-
52
-
53
-
54
-
55
-
56
-
57
-
58
-
59
-
60
-
61
-
62
-
63
-
64
-
65
-
66
-
67
-
68
-
69
-
70
-
71
-
72
-
73
-
74
-
75
-
76
-
77
-
78
-
79
-
80
-
81
-
82
-
 83
83 -
 84
84 -
 85
85 -
 86
86 -
 87
87 -
 88
88 -
 89
89 -
 90
90 -
 91
91 -
 92
92 -
 93
93 -
 94
94 -
 95
95 -
 96
96 -
 97
97 -
 98
98 -
 99
99 -
 100
100 -
 101
101 -
 102
102 -
 103
103 -
104
-
105
-
106
-
107
-
108
-
109
-
110
-
111
-
112
-
113
-
114
-
115
-
116
-
117
-
118
-
119
-
120
 |
 |

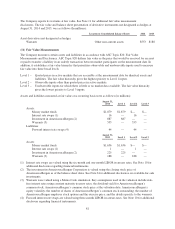
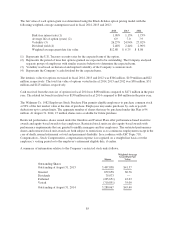
The fair value of each option grant was determined using the Black-Scholes option pricing model with the
following weighted-average assumptions used in fiscal 2014, 2013 and 2012:
2014 2013 2012
Risk-free interest rate (1) 1.98% 1.15% 1.73%
Average life of option (years) (2) 6.9 7.0 7.9
Volatility (3) 26.27% 24.94% 27.02%
Dividend yield (4) 2.48% 2.44% 2.90%
Weighted-average grant-date fair value $12.88 $ 6.75 $ 8.08
(1) Represents the U.S. Treasury security rates for the expected term of the option.
(2) Represents the period of time that options granted are expected to be outstanding. The Company analyzed
separate groups of employees with similar exercise behavior to determine the expected term.
(3) Volatility was based on historical and implied volatility of the Company’s common stock.
(4) Represents the Company’s cash dividend for the expected term.
The intrinsic value for options exercised in fiscal 2014, 2013 and 2012 was $346 million, $159 million and $22
million, respectively. The total fair value of options vested in fiscal 2014, 2013 and 2012 was $58 million, $51
million and $125 million, respectively.
Cash received from the exercise of options in fiscal 2014 was $490 million compared to $471 million in the prior
year. The related tax benefit realized was $130 million in fiscal 2014 compared to $60 million in the prior year.
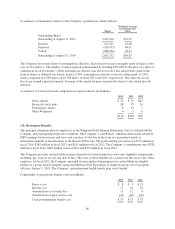
The Walgreen Co. 1982 Employees Stock Purchase Plan permits eligible employees to purchase common stock
at 90% of the fair market value at the date of purchase. Employees may make purchases by cash or payroll
deductions up to certain limits. The aggregate number of shares that may be purchased under this Plan is 94
million. At August 31, 2014, 15 million shares were available for future purchase.
Restricted performance shares issued under the Omnibus and Former Plans offer performance-based incentive
awards and equity-based awards to key employees. Restricted stock units are also equity-based awards with
performance requirements that are granted to middle managers and key employees. The restricted performance
shares and restricted stock unit awards are both subject to restrictions as to continuous employment except in the
case of death, normal retirement or total and permanent disability. In accordance with ASC Topic 718,
Compensation – Stock Compensation, compensation expense is recognized on a straight-line basis over the
employee’s vesting period or to the employee’s retirement eligible date, if earlier.
A summary of information relative to the Company’s restricted stock units follows:
Shares
Weighted-Average
Grant-Date Fair
Value
Outstanding Shares
Outstanding at August 31, 2013 3,497,838 $41.57
Granted 679,658 60.76
Dividends 79,073 —
Forfeited (265,651) 43.63
Vested (710,851) 35.09
Outstanding at August 31, 2014 3,280,067 $45.40
85