Walgreens 2014 Annual Report Download - page 68
Download and view the complete annual report
Please find page 68 of the 2014 Walgreens annual report below. You can navigate through the pages in the report by either clicking on the pages listed below, or by using the keyword search tool below to find specific information within the annual report.-
 1
1 -
2
-
3
-
4
-
5
-
6
-
7
-
8
-
9
-
10
-
11
-
12
-
13
-
14
-
15
-
16
-
17
-
18
-
19
-
20
-
21
-
22
-
23
-
24
-
25
-
26
-
27
-
28
-
29
-
30
-
31
-
32
-
33
-
34
-
35
-
36
-
37
-
38
-
39
-
40
-
41
-
42
-
43
-
44
-
45
-
46
-
47
-
48
-
49
-
50
-
51
-
52
-
53
-
54
-
55
-
56
-
57
-
 58
58 -
 59
59 -
 60
60 -
 61
61 -
 62
62 -
 63
63 -
 64
64 -
 65
65 -
 66
66 -
 67
67 -
 68
68 -
 69
69 -
 70
70 -
 71
71 -
 72
72 -
 73
73 -
 74
74 -
 75
75 -
 76
76 -
 77
77 -
 78
78 -
79
-
80
-
81
-
82
-
83
-
84
-
85
-
86
-
87
-
88
-
89
-
90
-
91
-
92
-
93
-
94
-
95
-
96
-
97
-
98
-
99
-
100
-
101
-
102
-
103
-
104
-
105
-
106
-
107
-
108
-
109
-
110
-
111
-
112
-
113
-
114
-
115
-
116
-
117
-
118
-
119
-
120
 |
 |

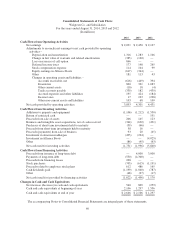
Consolidated Statements of Cash Flows
Walgreen Co. and Subsidiaries
For the years ended August 31, 2014, 2013 and 2012
(In millions)
2014 2013 2012
Cash Flows from Operating Activities
Net earnings $ 2,031 $ 2,450 $ 2,127
Adjustments to reconcile net earnings to net cash provided by operating
activities –
Depreciation and amortization 1,316 1,283 1,166
Change in fair value of warrants and related amortization (385) (120) —
Loss on exercise of call option 866 — —
Deferred income taxes 177 148 265
Stock compensation expense 114 104 99
Equity earnings in Alliance Boots (617) (344) —
Other 181 113 43
Changes in operating assets and liabilities –
Accounts receivable, net (616) (449) 394
Inventories 860 321 1,083
Other current assets (10) 18 (4)
Trade accounts payable (339) 182 (439)
Accrued expenses and other liabilities 195 424 (184)
Income taxes 17 103 (228)
Other non-current assets and liabilities 103 68 109
Net cash provided by operating activities 3,893 4,301 4,431
Cash Flows from Investing Activities
Additions to property and equipment (1,106) (1,212) (1,550)
Return of restricted cash — — 191
Proceeds from sale of assets 206 145 123
Business and intangible asset acquisitions, net of cash received (344) (630) (491)
Purchases of short term investments held to maturity (59) (66) —
Proceeds from short term investments held to maturity 58 16 —
Proceeds (payments) from sale of business 93 20 (45)
Investment in AmerisourceBergen (493) (224) —
Investment in Alliance Boots — — (4,025)
Other (86) (45) (63)
Net cash used for investing activities (1,731) (1,996) (5,860)
Cash Flows from Financing Activities
Proceeds from issuance of long-term debt — 4,000 3,000
Payments of long-term debt (550) (4,300) —
Proceeds from financing leases 268 — —
Stock purchases (705) (615) (1,191)
Proceeds related to employee stock plans 612 486 165
Cash dividends paid (1,199) (1,040) (787)
Other (48) (27) (17)
Net cash (used for) provided by financing activities (1,622) (1,496) 1,170
Changes in Cash and Cash Equivalents
Net increase (decrease) in cash and cash equivalents 540 809 (259)
Cash and cash equivalents at beginning of year 2,106 1,297 1,556
Cash and cash equivalents at end of year $ 2,646 $ 2,106 $ 1,297
The accompanying Notes to Consolidated Financial Statements are integral parts of these statements.
60