Walgreens 2014 Annual Report Download - page 53
Download and view the complete annual report
Please find page 53 of the 2014 Walgreens annual report below. You can navigate through the pages in the report by either clicking on the pages listed below, or by using the keyword search tool below to find specific information within the annual report.-
 1
1 -
2
-
3
-
4
-
5
-
6
-
7
-
8
-
9
-
10
-
11
-
12
-
13
-
14
-
15
-
16
-
17
-
18
-
19
-
20
-
21
-
22
-
23
-
24
-
25
-
26
-
27
-
28
-
29
-
30
-
31
-
32
-
33
-
34
-
35
-
36
-
37
-
38
-
39
-
40
-
41
-
42
-
 43
43 -
 44
44 -
 45
45 -
 46
46 -
 47
47 -
 48
48 -
 49
49 -
 50
50 -
 51
51 -
 52
52 -
 53
53 -
 54
54 -
 55
55 -
 56
56 -
 57
57 -
 58
58 -
 59
59 -
 60
60 -
 61
61 -
 62
62 -
 63
63 -
64
-
65
-
66
-
67
-
68
-
69
-
70
-
71
-
72
-
73
-
74
-
75
-
76
-
77
-
78
-
79
-
80
-
81
-
82
-
83
-
84
-
85
-
86
-
87
-
88
-
89
-
90
-
91
-
92
-
93
-
94
-
95
-
96
-
97
-
98
-
99
-
100
-
101
-
102
-
103
-
104
-
105
-
106
-
107
-
108
-
109
-
110
-
111
-
112
-
113
-
114
-
115
-
116
-
117
-
118
-
119
-
120
 |
 |
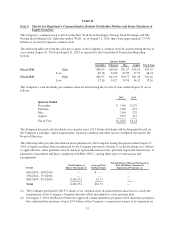
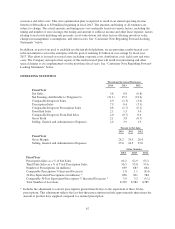
Alliance Boots reflected in the equity earnings in Alliance Boots due to the timing of this investment. Earnings
included amortization expense resulting from the fair value of certain Alliance Boots assets of $42 million and
$57 million in fiscal 2014 and 2013, respectively. Fiscal 2013 amortization included $23 million related to
inventory fair value adjustments.
Interest was a net expense of $156 million in fiscal 2014, $165 million in fiscal 2013 and $88 million in fiscal
2012. Interest expense for fiscal 2014, 2013 and 2012 was net of $6 million, $7 million, and $9 million,
respectively, which was capitalized to construction projects. The decrease in 2014 interest expense was due to the
repayment of the $550 million notes that matured in March 2014 and the $1.3 billion notes that matured in
August 2013, partially offset by higher interest charges related to incremental capital and finance lease
obligations. The increase in interest expense from fiscal 2012 to 2013 was due to the $4.0 billion note issuance in
September 2012, partially offset by the fixed to variable interest rate swaps on our $1.0 billion 5.250% notes and
the repayment of our $1.3 billion 4.875% notes in August 2013.
Other non-operating expense was $481 million in fiscal 2014 versus income of $120 million last year. In fiscal
2014, we recorded a loss of $866 million related to the Alliance Boots call option. Partially offsetting the loss
was an increase of $366 million in the fair value of the AmerisourceBergen warrants and $19 million for the
amortization of the deferred credit associated with the initial value of the warrants. The increase in the fair value
of the warrants was primarily attributable to the increase in the price of AmerisourceBergen’s common
stock. Other income in fiscal 2013 included an increase in the fair value of the AmerisourceBergen warrants and
amortization of the deferred credit of $111 million and $9 million, respectively.
The effective income tax rate was 42.9% for fiscal 2014, 37.1% for fiscal 2013 and 37.0% for 2012. The increase in
the effective tax rate from fiscal 2013 was primarily attributed to the loss associated with the Company’s option to
purchase the remaining equity interest in Alliance Boots, which did not generate a tax benefit in fiscal 2014,
partially offset by the favorable impact of additional foreign source income taxed at lower rates. The loss will be, in
part, a capital loss for tax purposes for which the Company did not have any capital gains to offset against and has
recorded a full valuation allowance. The capital loss on the Alliance Boots call option is available to be carried
forward and offset against future capital gains through fiscal 2020. The increase in the effective tax rate from fiscal
2012 compared to fiscal 2013 was primarily attributed to higher non-tax deductible permanent differences.
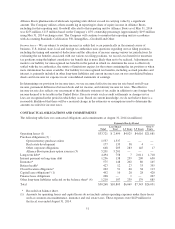
LIQUIDITY AND CAPITAL RESOURCES
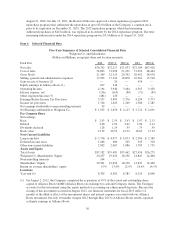
Cash and cash equivalents were $2.6 billion at August 31, 2014, compared to $2.1 billion at August 31,
2013. Short-term investment objectives are to minimize risk, maintain liquidity and maximize after-tax yields. To
attain these objectives, investment limits are placed on the amount, type and issuer of securities. Investments are
principally in U.S. Treasury market funds.
Our long-term capital policy is to maintain a strong balance sheet and financial flexibility; reinvest in our core
strategies; invest in strategic opportunities that reinforce our core strategies and meet return requirements; and
return surplus cash flow to shareholders in the form of dividends and share repurchases over the long term.
Net cash provided by operating activities was $3.9 billion at August 31, 2014, compared to $4.3 billion at
August 31, 2013. The decrease was primarily a result of changes in working capital balances compared to the
prior year. Cash provided by operations is the principal source of funds for expansion, investments, acquisitions,
remodeling programs, dividends to shareholders and stock repurchases.
Net cash used for investing activities was $1.7 billion for fiscal 2014 versus $2.0 billion for fiscal
2013. Additions to property and equipment were $1.1 billion compared to $1.2 billion last year. In 2014, the
Company opened or acquired 268 locations. Acquisitions included Kerr Drug, which contributed 76 drugstore
locations as well as a specialty pharmacy and a distribution center. In 2014, the Company had a net reduction of
273 locations primarily due to the sale of the Take Care Employer Solutions, LLC business, which consisted
primarily of worksite locations, and the Company’s efforts to close underperforming drugstores. Total locations
45