Walgreens 2014 Annual Report Download - page 66
Download and view the complete annual report
Please find page 66 of the 2014 Walgreens annual report below. You can navigate through the pages in the report by either clicking on the pages listed below, or by using the keyword search tool below to find specific information within the annual report.-
 1
1 -
2
-
3
-
4
-
5
-
6
-
7
-
8
-
9
-
10
-
11
-
12
-
13
-
14
-
15
-
16
-
17
-
18
-
19
-
20
-
21
-
22
-
23
-
24
-
25
-
26
-
27
-
28
-
29
-
30
-
31
-
32
-
33
-
34
-
35
-
36
-
37
-
38
-
39
-
40
-
41
-
42
-
43
-
44
-
45
-
46
-
47
-
48
-
49
-
50
-
51
-
52
-
53
-
54
-
55
-
 56
56 -
 57
57 -
 58
58 -
 59
59 -
 60
60 -
 61
61 -
 62
62 -
 63
63 -
 64
64 -
 65
65 -
 66
66 -
 67
67 -
 68
68 -
 69
69 -
 70
70 -
 71
71 -
 72
72 -
 73
73 -
 74
74 -
 75
75 -
 76
76 -
77
-
78
-
79
-
80
-
81
-
82
-
83
-
84
-
85
-
86
-
87
-
88
-
89
-
90
-
91
-
92
-
93
-
94
-
95
-
96
-
97
-
98
-
99
-
100
-
101
-
102
-
103
-
104
-
105
-
106
-
107
-
108
-
109
-
110
-
111
-
112
-
113
-
114
-
115
-
116
-
117
-
118
-
119
-
120
 |
 |

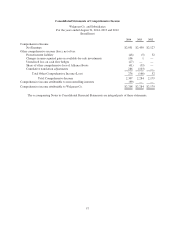
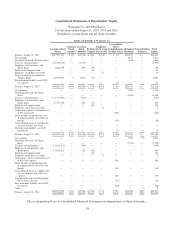
Consolidated Statements of Shareholders’ Equity
Walgreen Co. and Subsidiaries
For the years ended August 31, 2014, 2013 and 2012
(In millions, except shares and per share amounts)
Equity attributable to Walgreen Co.
Common Stock
Shares
Common
Stock
Amount
Treasury
Stock
Amount
Paid-In
Capital
Employee
Stock Loan
Receivable
Accumulated
Other
Comprehensive
Income (Loss)
Retained
Earnings
Noncontrolling
Interests
Total
Equity
Balance, August 31, 2011 889,294,130 $ 80 $(4,926) $ 834 $ (34) $ 16 $18,877 $— $14,847
Net earnings — — — — — — 2,127 — 2,127
Dividends declared ($.95 per share) — — — — — — (848) — (848)
Treasury stock purchases (34,720,215) — (1,191) — — — — — (1,191)
Employee stock purchase and
option plans 6,088,749 — 229 (75) — — — — 154
Stock-based compensation — — — 99 — — — — 99
Employee stock loan receivable — — — — 15 — — — 15
Shares issued for investment in
Alliance Boots 83,392,670 0 2,903 78 — — — — 2,981
Postretirement liability, net of $32
tax expense — — — — — 52 — — 52
Balance, August 31, 2012 944,055,334 $ 80 $(2,985) $ 936 $ (19) $ 68 $20,156 $— $18,236
Net earnings — — — — — — 2,450 — 2,450
Dividends declared ($1.14 per
share) — — — — — — (1,083) — (1,083)
Treasury stock purchases (13,797,490) — (615) — — — — — (615)
Employee stock purchase and
option plans 16,337,734 — 486 34 — — — — 520
Stock-based compensation — — — 104 — — — — 104
Employee stock loan receivable — — — — 8 — — — 8
Cumulative currency translation, net
of $55 tax benefit — — — — — (103) — — (103)
Share of other comprehensive loss
of Alliance Boots, net of $32 tax
benefit — — — — — (59) — — (59)
Unrecognized gain on available-for-
sale investments, net of tax — — — — — 1 — — 1
Postretirement liability, net of $3
tax benefit — — — — — (5) — — (5)
Balance, August 31, 2013 946,595,578 $ 80 $(3,114) $1,074 $ (11) $ (98) $21,523 $— $19,454
Net earnings — — — — — — 1,932 99 2,031
Dividends declared ($1.28 per
share) — — — — — — (1,226) — (1,226)
Treasury stock purchases (11,810,351) — (705) — — — — — (705)
Employee stock purchase and
option plans 15,601,662 — 622 (16) — — — — 606
Stock-based compensation — — — 114 — — — — 114
Employee stock loan receivable — — — — 6 — — — 6
Cumulative currency translation, net
of $154 tax expense — — — — — 286 — — 286
Share of other comprehensive loss
of Alliance Boots, net of $22 tax
benefit — — — — — (41) — — (41)
Unrecognized gain on available-for-
sale investments, net of $63 tax
expense — — — — — 106 — — 106
Unrealized loss on cash flow hedge,
net of $17 tax benefit — — — — — (27) — — (27)
Post retirement liability, net of $29
tax benefit — — — — — (48) — — (48)
Other — — — — — — — 5 5
Balance, August 31, 2014 950,386,889 $ 80 $(3,197) $1,172 $ (5) $ 178 $22,229 $104 $20,561
The accompanying Notes to Consolidated Financial Statements are integral parts of these statements.
58