Walgreens 2014 Annual Report Download - page 51
Download and view the complete annual report
Please find page 51 of the 2014 Walgreens annual report below. You can navigate through the pages in the report by either clicking on the pages listed below, or by using the keyword search tool below to find specific information within the annual report.-
 1
1 -
2
-
3
-
4
-
5
-
6
-
7
-
8
-
9
-
10
-
11
-
12
-
13
-
14
-
15
-
16
-
17
-
18
-
19
-
20
-
21
-
22
-
23
-
24
-
25
-
26
-
27
-
28
-
29
-
30
-
31
-
32
-
33
-
34
-
35
-
36
-
37
-
38
-
39
-
40
-
 41
41 -
 42
42 -
 43
43 -
 44
44 -
 45
45 -
 46
46 -
 47
47 -
 48
48 -
 49
49 -
 50
50 -
 51
51 -
 52
52 -
 53
53 -
 54
54 -
 55
55 -
 56
56 -
 57
57 -
 58
58 -
 59
59 -
 60
60 -
 61
61 -
62
-
63
-
64
-
65
-
66
-
67
-
68
-
69
-
70
-
71
-
72
-
73
-
74
-
75
-
76
-
77
-
78
-
79
-
80
-
81
-
82
-
83
-
84
-
85
-
86
-
87
-
88
-
89
-
90
-
91
-
92
-
93
-
94
-
95
-
96
-
97
-
98
-
99
-
100
-
101
-
102
-
103
-
104
-
105
-
106
-
107
-
108
-
109
-
110
-
111
-
112
-
113
-
114
-
115
-
116
-
117
-
118
-
119
-
120
 |
 |
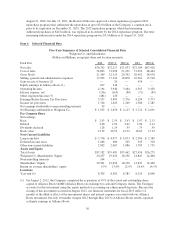
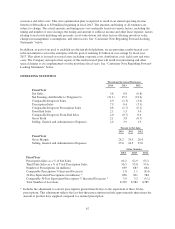
RESULTS OF OPERATIONS
Fiscal 2014 net earnings attributable to Walgreen Co. decreased 21.1% to $1.9 billion, or $2.00 per diluted share,
versus net earnings of $2.5 billion, or $2.56 per diluted share, in fiscal 2013. The decrease was primarily
attributable to lower gross margins, a loss related to the Alliance Boots call option and a higher effective tax rate,
partially offset by higher sales, lower selling, general and administrative expenses as a percentage of sales,
increased equity earnings in Alliance Boots and increased gains on fair market value adjustments related to the
AmerisourceBergen warrants. Included in net earnings and net earnings per diluted share, respectively, were the
negative impacts of an $866 million, or $0.90 per diluted share, loss on the Alliance Boots call option; $238
million, or $0.25 per diluted share, in acquisition-related amortization; $179 million, or $0.18 per diluted share,
of store closure and other optimization costs; $167 million, or $0.17 per diluted share, in Alliance Boots related
tax; $86 million, or $0.09 per diluted share, of LIFO provision; and $54 million, or $0.06 per diluted share, of
acquisition-related costs. Net earnings in fiscal 2014 were positively impacted by $351 million, or $0.36 per
diluted share, from the combined fair value adjustments and amortization related to both our and Alliance Boots
warrants to purchase AmerisourceBergen common stock and $6 million, or $0.01 per diluted share, from the gain
on sale of the Take Care Employer Solutions, LLC business. Included in fiscal 2013 net earnings and net
earnings per diluted share, respectively, were the negative impacts of $241 million, or $0.25 per diluted share, in
acquisition-related amortization; $151 million, or $0.16 per diluted share, of LIFO provision; $124 million, or
$0.13 per diluted share, in Alliance Boots related tax; $60 million, or $0.06 per diluted share, of acquisition-
related costs; $47 million, or $0.05 per diluted share, relating to a legal settlement with the Drug Enforcement
Administration (DEA); $24 million, or $0.03 per diluted share, in costs related to Hurricane Sandy; and $8
million, or $0.01 per diluted share, in costs related to the completion of a pharmaceutical distribution contract.
Net earnings in fiscal 2013 were positively impacted by $110 million, or $0.12 per diluted share, from the
combined fair value adjustments and amortization related to both our and Alliance Boots warrants to purchase
AmerisourceBergen common stock and $13 million, or $0.01 per diluted share, from an additional gain on the
2011 sale of the Walgreens Health Initiatives, Inc. business relating to a client retention escrow.
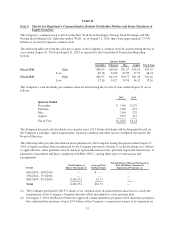
Net sales increased by 5.8% to $76.4 billion in fiscal 2014 compared to an increase of 0.8% in 2013 and a
decrease of 0.8% in 2012. Net sales growth in fiscal 2014 was attributed to new store sales and an increase in
comparable drugstore sales over the prior year. In fiscal 2013, sales were positively impacted by our decision to
rejoin the Express Scripts pharmacy provider network and the acquisition of USA Drug and BioScrip assets, both
of which were partially offset by lower comparable store sales. Sales in comparable drugstores increased 4.9% in
2014 compared to decreases of 1.3% and 3.6% in 2013 and 2012, respectively. Comparable drugstores are
defined as those that have been open for at least twelve consecutive months without closure for seven or more
consecutive days and without a major remodel or a natural disaster in the past twelve months. Relocated and
acquired stores are not included as comparable stores for the first twelve months after the relocation or
acquisition. We operated 8,309 locations (8,207 drugstores) at August 31, 2014, compared to 8,582 locations
(8,116 drugstores) at August 31, 2013 and 8,385 locations (7,930 drugstores) at August 31, 2012.
Prescription sales increased 7.9% in 2014 compared to an increase of 0.4% in 2013 and a decrease of 3.1% in
2012. Comparable drugstore prescription sales increased 6.8% in 2014 compared to decreases of 1.7% and 6.1% in
2013 and 2012, respectively. The effect of generic drugs, which have a lower retail price, replacing brand name
drugs reduced prescription sales by 1.3% for 2014, 5.3% for 2013, and 3.5% for 2012, while the effect on total sales
was 0.7% for 2014, 3.0% for 2013 and 1.9% for 2012. New generic drug introductions have led to an increased
proportion of generics on total net sales. Third party sales, where reimbursement is received from managed care
organizations, the government, employers or private insurers, were 96.5% of prescription sales in 2014, 95.8% of
prescription sales in 2013, and 95.6% of prescription sales in 2012. We receive market-driven reimbursements from
third party payers, a number of which typically reset in January. The total number of prescriptions filled (including
immunizations) was approximately 699 million in 2014, 683 million in 2013 and 664 million in 2012. Prescriptions
adjusted to 30-day equivalents were 856 million in 2014, 821 million in 2013 and 784 million in 2012.
Front-end sales increased 2.1% in 2014, 1.5% in 2013 and 3.6% in 2012. The increase over the prior year was
due, in part, to new store openings and improved sales related to non-prescription drugs, convenience and fresh
43