Tyson Foods 2001 Annual Report Download - page 59
Download and view the complete annual report
Please find page 59 of the 2001 Tyson Foods annual report below. You can navigate through the pages in the report by either clicking on the pages listed below, or by using the keyword search tool below to find specific information within the annual report.-
 1
1 -
2
-
3
-
4
-
5
-
6
-
7
-
8
-
9
-
10
-
11
-
12
-
13
-
14
-
15
-
16
-
17
-
18
-
19
-
20
-
21
-
22
-
23
-
24
-
25
-
26
-
27
-
28
-
29
-
30
-
31
-
32
-
33
-
34
-
35
-
36
-
37
-
38
-
39
-
40
-
41
-
42
-
43
-
44
-
45
-
46
-
47
-
48
-
 49
49 -
 50
50 -
 51
51 -
 52
52 -
 53
53 -
 54
54 -
 55
55 -
 56
56 -
 57
57 -
 58
58 -
 59
59 -
 60
60 -
 61
61 -
 62
62 -
 63
63 -
 64
64
 |
 |

57
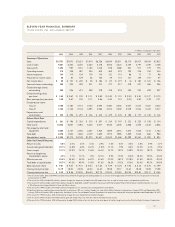
ELEVEN-YEAR FINANCIAL SUMMARY
TYSON FOODS, INC. 2001 ANNUAL REPORT
in millions, except per share data
2001
2000 1999 1998 1997 1996 1995 1994 1993 1992 1991
Summary of Operations
Sales
$10,751
$7,410 $7,621 $7,414 $6,356 $6,454 $5,511 $5,110 $4,707 $4,169 $3,922
Cost of sales
9,661
6,453 6,470 6,260 5,318 5,506 4,423 4,149 3,797 3,390 3,148
Gross profit
1,090
957 1,151 1,154 1,038 948 1,088 961 911 779 775
Operating income
315
348 487 204 400 269 472 195 376 332 334
Interest expense
144
115 124 139 110 133 115 86 73 77 96
Provision for income taxes
58
83 129 46 144 49 131 121 129 101 97
Net income (loss)
$88
$ 151 $ 230 $ 25 $ 186 $ 87 $ 219 $ (2) $ 180 $ 161 $ 146
Year end shares outstanding
349
225 229 231 213 217 217 218 221 206 206
Diluted average shares
outstanding
222
226 231 228 218 218 218 222 223 208 207
Diluted earnings (loss)
per share
$0.40
$ 0.67 $ 1.00 $ 0.11 $ 0.85 $ 0.40 $ 1.01 $ (0.01) $ 0.81 $ 0.77 $ 0.70
Basic earnings (loss) per share
0.40
0.67 1.00 0.11 0.86 0.40 1.01 (0.01) 0.82 0.78 0.71
Dividends per share:
Class A
0.160
0.160 0.115 0.100 0.095 0.080 0.053 0.047 0.027 0.027 0.020
Class B
0.144
0.144 0.104 0.090 0.086 0.072 0.044 0.039 0.022 0.022 0.017
Depreciation and
amortization
$ 335
$ 294 $ 291 $ 276 $ 230 $ 239 $ 205 $ 188 $ 177 $ 149 $ 136
Balance Sheet Data
Capital expenditures
$ 261
$ 196 $ 363 $ 310 $ 291 $ 214 $ 347 $ 232 $ 225 $ 108 $ 214
Total assets
10,632
4,841 5,083 5,242 4,411 4,544 4,444 3,668 3,254 2,618 2,646
Net property, plant and
equipment
4,085
2,141 2,185 2,257 1,925 1,869 2,014 1,610 1,435 1,142 1,162
Total debt
4,776
1,542 1,804 2,129 1,690 1,975 1,985 1,455 1,024 826 984
Shareholders’ equity
$ 3,354
$2,175 $2,128 $1,970 $1,621 $1,542 $1,468 $1,289 $1,361 $ 980 $ 823
Other Key Financial Measures
Return on sales
0.8%
2.0% 3.0% 0.3% 2.9% 1.4% 4.0% 0.0% 3.8% 3.9% 3.7%
Annual sales growth (decline)
45.1%
(2.8)% 2.8% 16.7% (1.5)% 17.1% 7.9% 8.6% 12.9% 6.3% 2.5%
Gross margin
10.1%
12.9% 15.1% 15.6% 16.3% 14.7% 19.7% 18.8% 19.4% 18.7% 19.8%
Return on beginning
shareholders’ equity
4.0%
7.1% 11.7% 1.5% 12.1% 5.9% 17.0% (0.2)% 18.4% 19.5% 22.0%
Effective tax rate
35.4%
35.6% 34.9% 64.7% 43.6% 37.0% 38.1% 101.8% 41.8% 38.5% 40.0%
Total debt to capitalization
58.7%
41.5% 45.9% 51.9% 51.0% 56.2% 57.5% 53.0% 42.9% 45.7% 54.5%
Book value per share
$9.61
$ 9.67 $ 9.31 $ 8.53 $ 7.60 $ 7.09 $ 6.76 $ 5.92 $ 6.16 $ 4.75 $ 3.99
Closing stock price high
14.19
18.00 25.38 24.44 23.63 18.58 18.17 16.67 18.08 15.08 15.58
Closing stock price low
$8.35
$ 8.56 $15.00 $16.50 $17.75 $13.83 $13.83 $12.50 $12.83 $10.17 $ 8.46
1.The results for 2001, 2000 and 1999 have been reclassified for shipping and handling expenses as a result of the application of EITF 00-10. It is not practical to reclassify
amounts prior to 1999.
2.The results for 2001 include $26 million in pretax charges for expenses related to the IBP acquisition, loss on sale of swine assets, and product recall losses.
3.The results for 2000 include a $24 million pretax charge for bad debt writeoff related to the January 2000 bankruptcy filing of AmeriServe Food Distribution, Inc. and
a $9 million pretax charge related to Tyson de Mexico losses.
4.The results for 1999 include a $77 million pretax charge for loss on sale of assets and impairment write-downs.
5.Significant business combinations accounted for as purchases: IBP, inc., Hudson Foods, Inc. and Arctic Alaska Fisheries Corporation in August 2001 and September 2001,
January 1998 and October 1992, respectively. See Note 2 to the Consolidated Financial Statements for acquisitions during the three-year period ended September 29, 2001.
6.The results for 1998 include a $215 million pretax charge for asset impairment and other charges.
7.The results for 1997 include a $41 million pretax gain ($4 million after tax) from the sale of the beef division assets.
8.The results for 1994 include a $214 million pretax charge ($205 million after tax) due to the write-down of certain long-lived assets of Arctic Alaska Fisheries Corporation.