Tyson Foods 2001 Annual Report Download - page 36
Download and view the complete annual report
Please find page 36 of the 2001 Tyson Foods annual report below. You can navigate through the pages in the report by either clicking on the pages listed below, or by using the keyword search tool below to find specific information within the annual report.-
 1
1 -
2
-
3
-
4
-
5
-
6
-
7
-
8
-
9
-
10
-
11
-
12
-
13
-
14
-
15
-
16
-
17
-
18
-
19
-
20
-
21
-
22
-
23
-
24
-
25
-
 26
26 -
 27
27 -
 28
28 -
 29
29 -
 30
30 -
 31
31 -
 32
32 -
 33
33 -
 34
34 -
 35
35 -
 36
36 -
 37
37 -
 38
38 -
 39
39 -
 40
40 -
 41
41 -
 42
42 -
 43
43 -
 44
44 -
 45
45 -
 46
46 -
47
-
48
-
49
-
50
-
51
-
52
-
53
-
54
-
55
-
56
-
57
-
58
-
59
-
60
-
61
-
62
-
63
-
64
 |
 |

34
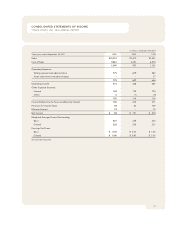
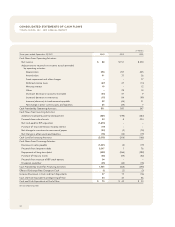
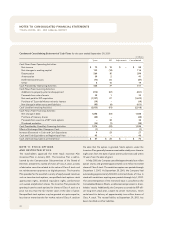
CONSOLIDATED STATEMENTS OF CASH FLOWS
TYSON FOODS, INC. 2001 ANNUAL REPORT
in millions
Three years ended September 29, 2001
2001
2000 1999
Cash Flows From Operating Activities:
Net income
$88
$ 151 $ 230
Adjustments to reconcile net income to cash provided
by operating activities:
Depreciation
294
257 255
Amortization
41
37 36
Asset impairment and other charges
–
–77
Deferred income taxes
(47)
47 (13)
Minority interest
19
–12
Other
–
29 12
(Increase) decrease in accounts receivable
(43)
57 9
(Increase) decrease in inventories
(15)
84 (99)
Increase (decrease) in trade accounts payable
89
(46) 21
Net change in other current assets and liabilities
85
(29) 7
Cash Provided by Operating Activities
511
587 547
Cash Flows From Investing Activities:
Additions to property, plant and equipment
(261)
(196) (363)
Proceeds from sale of assets
33
4 234
Net cash paid for IBP acquisition
(1,670)
––
Purchase of Tyson de Mexico minority interest
(19)
––
Net change in investment in commercial paper
(23)
(2) (18)
Net change in other assets and liabilities
(78)
(12) (19)
Cash Used for Investing Activities
(2,018)
(206) (166)
Cash Flows From Financing Activities:
Decrease in notes payable
(1,031)
(4) (19)
Proceeds from long-term debt
3,047
776
Repayments of long-term debt
(432)
(266) (382)
Purchase of treasury shares
(48)
(69) (52)
Proceeds from exercise of IBP stock options
34
––
Dividends and other
(35)
(34) (18)
Cash Provided by (Used for) Financing Activities
1,535
(366) (395)
Effect of Exchange Rate Change on Cash
(1)
(2) (2)
Increase (Decrease) in Cash and Cash Equivalents
27
13 (16)
Cash and Cash Equivalents at Beginning of Year
43
30 46
Cash and Cash Equivalents at End of Year
$70
$43 $30
See accompanying notes.