Tyson Foods 2001 Annual Report Download - page 27
Download and view the complete annual report
Please find page 27 of the 2001 Tyson Foods annual report below. You can navigate through the pages in the report by either clicking on the pages listed below, or by using the keyword search tool below to find specific information within the annual report.-
 1
1 -
2
-
3
-
4
-
5
-
6
-
7
-
8
-
9
-
10
-
11
-
12
-
13
-
14
-
15
-
16
-
 17
17 -
 18
18 -
 19
19 -
 20
20 -
 21
21 -
 22
22 -
 23
23 -
 24
24 -
 25
25 -
 26
26 -
 27
27 -
 28
28 -
 29
29 -
 30
30 -
 31
31 -
 32
32 -
 33
33 -
 34
34 -
 35
35 -
 36
36 -
 37
37 -
38
-
39
-
40
-
41
-
42
-
43
-
44
-
45
-
46
-
47
-
48
-
49
-
50
-
51
-
52
-
53
-
54
-
55
-
56
-
57
-
58
-
59
-
60
-
61
-
62
-
63
-
64
 |
 |

25
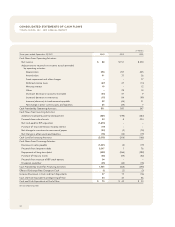
MANAGEMENT
’S DISCUSSION AND ANALYSIS
TYSON FOODS, INC. 2001 ANNUAL REPORT
Segment Information
The IBP acquisition resulted in changes to reportable segments in
2001. The segments for 2000 and 1999 were restated to conform
with the 2001 presentation. The Company did not have a Beef
segment in periods prior to 2001.
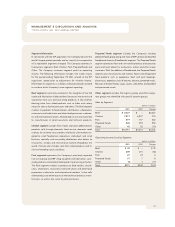
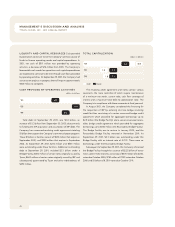
Sales by Segment
dollars in millions
2000 1999 Change
Chicken $6,907 $6,906 $ 1
Pork 157 109 48
Prepared Foods 294 301 (7)
Other 52 305 (253)
Total $7,410 $7,621 $(211)
Operating Income (Loss) by Segment
dollars in millions
2000 1999 Change
Chicken $315 $616 $(301)
Pork 23 (98) 121
Prepared Foods 7 (31) 38
Other 3 – 3
Total $348 $487 $(139)
Chicken segment sales increased slightly compared to 1999 with
a 0.4% increase in volume offset by a 0.3% decrease in average
sales prices. Foodservice channel sales decreased $34 million or
1.0%, retail channel sales remained level and international sales
including Tyson de Mexico decreased $5 million or 0.7% com-
pared to 1999. The offsetting increase in sales resulted primarily
from the Company’s chicken breeding stock subsidiary and
the Company’s allied products. Operating income for Chicken
decreased $301 million or $48.9% from 1999 primarily due to
lower market prices, higher grain costs and changes in product
mix. In addition, the Company’s Mexican subsidiary suffered
losses from the outbreak of Exotic Newcastle disease and result-
ing decreases in production, and the Chicken segment had a
$24 million bad debt writeoff related to the January 2000
bankruptcy filing by AmeriServe.
Pork segment sales increased $48 million or 43.6% over 1999,
with a 56.5% increase in average sales prices partially offset by
an 8.3% decrease in volume. Pork segment operating income
improved $121 million or 123.1% over 1999 primarily due to the
increase in average sales prices and the write-down of pork
assets at the end of 1999 due to the anticipated sale of the
pork business. The Company’s Pork segment includes feeder pig
finishing and marketing of swine to regional and national packers.
Prepared Foods segment sales totaled $294 million compared
to $301 million for 1999. The Prepared Foods segment operating
income increased $38 million from 1999. The increase in operat-
ing income is primarily due to the 1999 impairment charge of
$23 million related to the write-down of Mallard’s Food Products’
property and equipment and goodwill. Also, in 1999, the Prepared
Foods segment experienced losses related to product recalls.
Other segment sales decreased $253 million or 83.2% from
1999 primarily due to the sale of the seafood and other non-
core businesses during fiscal 1999.