Tyson Foods 2001 Annual Report Download - page 51
Download and view the complete annual report
Please find page 51 of the 2001 Tyson Foods annual report below. You can navigate through the pages in the report by either clicking on the pages listed below, or by using the keyword search tool below to find specific information within the annual report.-
 1
1 -
2
-
3
-
4
-
5
-
6
-
7
-
8
-
9
-
10
-
11
-
12
-
13
-
14
-
15
-
16
-
17
-
18
-
19
-
20
-
21
-
22
-
23
-
24
-
25
-
26
-
27
-
28
-
29
-
30
-
31
-
32
-
33
-
34
-
35
-
36
-
37
-
38
-
39
-
40
-
 41
41 -
 42
42 -
 43
43 -
 44
44 -
 45
45 -
 46
46 -
 47
47 -
 48
48 -
 49
49 -
 50
50 -
 51
51 -
 52
52 -
 53
53 -
 54
54 -
 55
55 -
 56
56 -
 57
57 -
 58
58 -
 59
59 -
 60
60 -
 61
61 -
62
-
63
-
64
 |
 |

49
NOTES TO CONSOLIDATED FINANCIAL STATEMENTS
TYSON FOODS, INC. 2001 ANNUAL REPORT
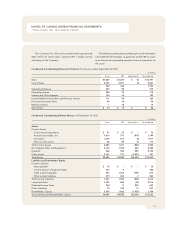
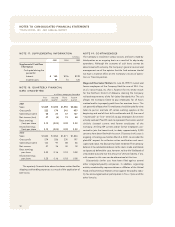
The majority of the Company’s operations are domiciled in
the United States. Approximately 97% of sales to external cus-
tomers for the fiscal years ended 2001, 2000 and 1999 were sourced
from the United States. Approximately $6.6 billion, $3.0 billion
and $3.1 billion of long-lived assets were located in the United
States at fiscal years ended 2001, 2000 and 1999, respectively.
Approximately $204 million, $74 million and $74 million of long-
lived assets were located in foreign countries, primarily Mexico and
Canada, at fiscal years ended 2001, 2000 and 1999, respectively.
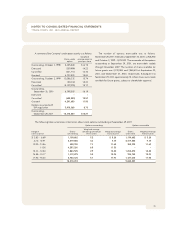
The Company sells certain of its products in foreign mar-
kets, primarily Canada, China, Japan, Mexico, Puerto Rico, Russia
and South Korea. The Company’s export sales for 2001, 2000 and
1999 totaled $1.2 billion, $550 million and $546 million, respec-
tively. Substantially all of the Company’s export sales are transacted
through unaffiliated brokers, marketing associations and foreign
sales staffs. Foreign sales were less than 10% of total consolidated
sales for 2001, 2000 and 1999, respectively.
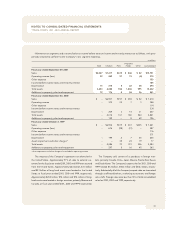
Information on segments and a reconciliation to income before taxes on income and minority interest are as follows, with prior
periods restated to conform to the Company’s new segment reporting:
in millions
Prepared
Beef Chicken Pork Foods Other Consolidated
Fiscal year ended September 29, 2001
Sales
$2,027 $7,217 $619 $ 846 $ 42 $10,751
Operating income (loss)
32 249 27 15 (8) 315
Other expense
150
Income before income taxes and minority interest
165
Depreciation
15 214 5 22 38 294
Total assets
3,203 4,084 944 1,406 995 10,632
Additions to property, plant and equipment
19 176 4 26 36 261
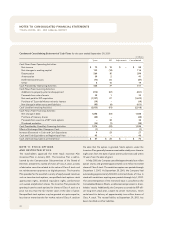
Fiscal year ended September 30, 2000
Sales $ – $6,907 $157 $ 294 $ 52 $ 7,410
Operating income – 315 23 7 3 348
Other expense 114
Income before income taxes and minority interest 234
Depreciation – 209 3 14 31 257
Total assets – 4,016 101 180 544 4,841
Additions to property, plant and equipment – 139 – 8 49 196
Fiscal year ended October 2, 1999
Sales $ – $6,906 $109 $ 301 $305 $ 7,621
Operating income (loss) – 616 (98) (31) – 487
Other expense 116
Income before income taxes and minority interest 371
Depreciation – 199 4 7 45 255
Asset impairment and other charges* – – 35 23 19 77
Total assets – 4,286 70 191 536 5,083
Additions to property, plant and equipment – 297 5 16 45 363
*Asset impairment and other charges also included in operating income