Tyson Foods 2001 Annual Report Download - page 47
Download and view the complete annual report
Please find page 47 of the 2001 Tyson Foods annual report below. You can navigate through the pages in the report by either clicking on the pages listed below, or by using the keyword search tool below to find specific information within the annual report.-
 1
1 -
2
-
3
-
4
-
5
-
6
-
7
-
8
-
9
-
10
-
11
-
12
-
13
-
14
-
15
-
16
-
17
-
18
-
19
-
20
-
21
-
22
-
23
-
24
-
25
-
26
-
27
-
28
-
29
-
30
-
31
-
32
-
33
-
34
-
35
-
36
-
 37
37 -
 38
38 -
 39
39 -
 40
40 -
 41
41 -
 42
42 -
 43
43 -
 44
44 -
 45
45 -
 46
46 -
 47
47 -
 48
48 -
 49
49 -
 50
50 -
 51
51 -
 52
52 -
 53
53 -
 54
54 -
 55
55 -
 56
56 -
 57
57 -
58
-
59
-
60
-
61
-
62
-
63
-
64
 |
 |

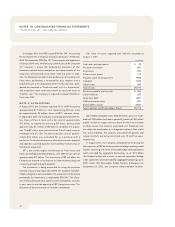
45
NOTES TO CONSOLIDATED FINANCIAL STATEMENTS
TYSON FOODS, INC. 2001 ANNUAL REPORT
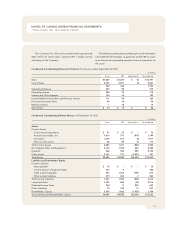
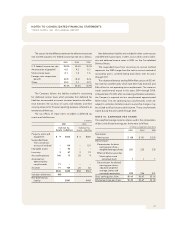
A summary of the Company’s stock option activity is as follows:
Weighted
Shares under average exercise
option price per share
Outstanding, October 3, 1998 8,355,548 $16.15
Exercised (359,999) 14.23
Cancelled (631,717) 16.35
Granted 4,722,500 15.00
Outstanding, October 2, 1999 12,086,332 15.74
Exercised (88,332) 14.23
Cancelled (5,199,995) 15.17
Outstanding,
September 30, 2000 6,798,005 16.19
Exercised
––
Cancelled
(689,520) 15.57
Granted
4,291,650 11.50
Options assumed with
IBP acquisition
5,918,068 8.70
Outstanding,
September 29, 2001
16,318,203 $12.27
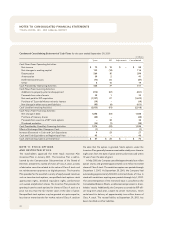
The number of options exercisable was as follows:
September 29, 2001– 9,644,323; September 30, 2000 – 2,926,980
and October 2, 1999 –1,870,893. The remainder of the options
outstanding at September 29, 2001, are exercisable ratably
through November 2007. The number of shares available for
future grants was 2,742,800 and 7,568,614 at September 29,
2001, and September 30, 2000, respectively. Subsequent to
September 29, 2001, approximately 14 million shares were made
available for future grants, subject to shareholder approval.
The following table summarizes information about stock options outstanding at September 29, 2001:
Options outstanding Options exercisable
Weighted average
Range of Shares remaining contractual Weighted average Shares Weighted average
exercise prices outstanding life (in years) exercise price exercisable exercise price
$ 2.83 – 6.69
1,139,682 5.2 $ 5.28 1,139,682 $ 5.28
6.72 – 10.91
4,419,686 4.3 9.35 4,419,686 9.35
10.92 – 13.86
358,700 7.3 11.60 358,700 11.60
11.50
4,257,200 6.5 11.50 – –
14.33 – 14.50
1,863,535 2.9 14.40 1,814,470 14.40
14.58 – 15.17
1,319,275 5.0 15.04 784,755 15.03
17.92 – 18.00
2,960,125 5.1 17.93 1,127,030 17.92
16,318,203 9,644,323