Tyson Foods 2001 Annual Report Download - page 26
Download and view the complete annual report
Please find page 26 of the 2001 Tyson Foods annual report below. You can navigate through the pages in the report by either clicking on the pages listed below, or by using the keyword search tool below to find specific information within the annual report.-
 1
1 -
2
-
3
-
4
-
5
-
6
-
7
-
8
-
9
-
10
-
11
-
12
-
13
-
14
-
15
-
 16
16 -
 17
17 -
 18
18 -
 19
19 -
 20
20 -
 21
21 -
 22
22 -
 23
23 -
 24
24 -
 25
25 -
 26
26 -
 27
27 -
 28
28 -
 29
29 -
 30
30 -
 31
31 -
 32
32 -
 33
33 -
 34
34 -
 35
35 -
 36
36 -
37
-
38
-
39
-
40
-
41
-
42
-
43
-
44
-
45
-
46
-
47
-
48
-
49
-
50
-
51
-
52
-
53
-
54
-
55
-
56
-
57
-
58
-
59
-
60
-
61
-
62
-
63
-
64
 |
 |

24
MANAGEMENT
’S DISCUSSION AND ANALYSIS
TYSON FOODS, INC. 2001 ANNUAL REPORT
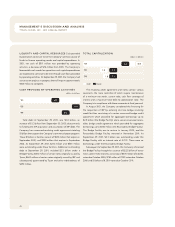
Beef segment sales, which include only the nine weeks of IBP
results, were $2 billion, including case-ready sales of $116 mil-
lion. Beef segment operating income totaled $32 million. Beef
sales and operating income are derived solely from the oper-
ations acquired from IBP, and as such have no comparative
data since the Company did not have a beef group prior to the
IBP acquisition.
Chicken segment sales increased $310 million or 4.5% compared
to 2000, with a 3.4% increase in average sales prices and a 1.0%
increase in volume. Foodservice channel sales increased 1.8%,
retail channel sales increased 1.2% and international channel sales
including Tyson de Mexico increased 25.8%. Operating income
for Chicken decreased $66 million or 20.9% from 2000 primarily
due to increased production costs and sales promotional expenses
which more than offset increases in bulk leg quarter prices and
certain other products.
Pork segment sales were $619 million compared to $157 million
last year, with current year case-ready sales of $43 million. Pork
segment operating profit increased $4 million from the same
period last year. The increase in both Pork segment sales and
operating income is primarily due to the inclusion of nine weeks
results for IBP.
Prepared Foods segment sales totaled $846 million compared
to $294 million last year. The Prepared Foods segment operat-
ing income increased $8 million from the same period last year.
The increase in both the Prepared Foods segment sales and
segment operating income is primarily due to the inclusion of
nine weeks results related to IBP.
2000 vs. 1999
Sales decreased 2.8% from sales for 1999. This decrease is
primarily due to the sale of the seafood business in July 1999,
and other divested non-core businesses. Comparable sales
increased 0.5% on a volume increase of 0.3% compared to 1999.
Additionally, the operating results for 2000 were negatively
affected by a weak domestic market for chicken and reduced
volume by the Company’s Mexican subsidiary. In response to the
oversupply of chicken, the Company maintained throughout
fiscal 2000 a 3% cut in the number of chickens produced.
Cost of sales decreased 0.3% as compared to 1999. This decrease
is primarily the result of decreased sales. As a percent of sales,
cost of sales was 87.1% for 2000 compared to 84.9% for 1999. The
increase in cost of sales as a percent of sales was due to the weak
domestic market for chicken, the reduction in volume associated
with the Company’s ongoing production cuts, losses incurred by
the Company’s Mexican subsidiary and higher grain costs.
Operating expenses decreased 8.4% from 1999, primarily due
to impairment and other charges of $77 million recorded in 1999
partially offset by a $21 million increase in 2000. The increase in
2000 expenses is due primarily to a $24 million bad debt write-
off related to the January 2000 bankruptcy filing by AmeriServe
and other increases related to ongoing litigation costs, partially
offset by a $12 million decrease in sales promotion expense.
Interest expense decreased 7.3% compared to 1999. As a percent
of sales, interest expense was 1.6% in both 2000 and 1999. The
Company had a lower level of borrowing in 2000, which
decreased the Company’s average indebtedness by 14.8% over
the same period last year. The Company’s short-term interest
rates were slightly higher than the same period for 1999, and the
net average effective interest rate on total debt was 6.9% for
2000 compared to 6.2% for 1999.
The effective tax rate increased minimally to 35.6% compared
to 34.9% for 1999.