Tesco 2012 Annual Report Download - page 76
Download and view the complete annual report
Please find page 76 of the 2012 Tesco annual report below. You can navigate through the pages in the report by either clicking on the pages listed below, or by using the keyword search tool below to find specific information within the annual report.-
 1
1 -
2
-
3
-
4
-
5
-
6
-
7
-
8
-
9
-
10
-
11
-
12
-
13
-
14
-
15
-
16
-
17
-
18
-
19
-
20
-
21
-
22
-
23
-
24
-
25
-
26
-
27
-
28
-
29
-
30
-
31
-
32
-
33
-
34
-
35
-
36
-
37
-
38
-
39
-
40
-
41
-
42
-
43
-
44
-
45
-
46
-
47
-
48
-
49
-
50
-
51
-
52
-
53
-
54
-
55
-
56
-
57
-
58
-
59
-
60
-
61
-
62
-
63
-
64
-
65
-
 66
66 -
 67
67 -
 68
68 -
 69
69 -
 70
70 -
 71
71 -
 72
72 -
 73
73 -
 74
74 -
 75
75 -
 76
76 -
 77
77 -
 78
78 -
 79
79 -
 80
80 -
 81
81 -
 82
82 -
 83
83 -
 84
84 -
 85
85 -
 86
86 -
87
-
88
-
89
-
90
-
91
-
92
-
93
-
94
-
95
-
96
-
97
-
98
-
99
-
100
-
101
-
102
-
103
-
104
-
105
-
106
-
107
-
108
-
109
-
110
-
111
-
112
-
113
-
114
-
115
-
116
-
117
-
118
-
119
-
120
-
121
-
122
-
123
-
124
-
125
-
126
-
127
-
128
-
129
-
130
-
131
-
132
-
133
-
134
-
135
-
136
-
137
-
138
-
139
-
140
-
141
-
142
-
143
-
144
-
145
-
146
-
147
-
148
-
149
-
150
-
151
-
152
-
153
-
154
-
155
-
156
-
157
-
158
 |
 |

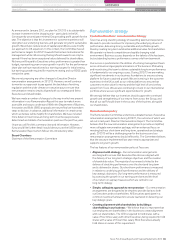
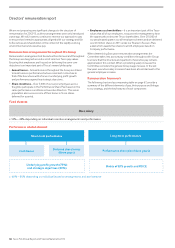
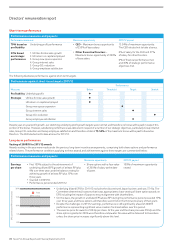
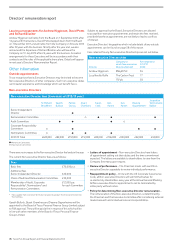
Short-term performance
Performance measures and payouts
Performance measures Maximum opportunity 2011/12 payout
70% based on
profitability
Underlying profit performance CEO – Maximum bonus opportunity
of 250% of base salary.
Other Executive Directors –
Maximum bonus opportunity of 200%
of base salary.
13.54% of maximum opportunity.
TheCEO elected not to take a bonus.
0% of salary for the CEO and 27%
ofsalary for other Directors.
0% of financial performance met
and45% of strategic performance
objectives met.
30% based
on strategic
performance
1. UK like-for-like sales growth
2. UK return on capital employed
3. Group new space expansion
4. Group internet sales
5. Group CO2 reduction
6. Group employee satisfaction
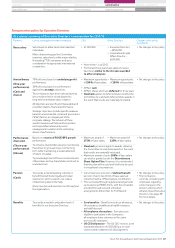
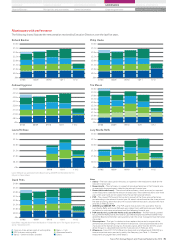
The following illustrates performance against short-term targets.
Performance against short-term targets 2011/12
Performance
Measures Below Threshold Target Stretch
Profitability Underlying profit
Strategic UK like-for-like sales growth
UK return on capital employed
Group new space expansion
Group internet sales
Group CO2 reduction
Group employee satisfaction
Despite year-on-year profit growth, our stretching underlying profit growth targets were not met and therefore no bonus will be paid in respect this
portion of the bonus. However, satisfactory performance was delivered in respect of a number of our strategic objectives, particularly Group internet
sales, Group CO2 reduction and Group employee satisfaction and therefore a total of 13.54% of the maximum bonus will be paid to Executive
Directors. TheCEO elected not to take a bonus for 2011/12.
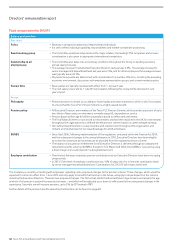
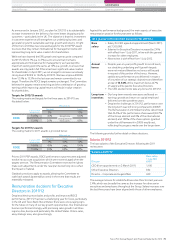
Long-term performance
Vesting of 2009/10 to 2011/12 awards
Awards vesting in the year were made under the previous long-term incentive arrangements, comprising both share options and performance
related shares. The performance conditions applying to these awards and achievement against these targets are summarised below:
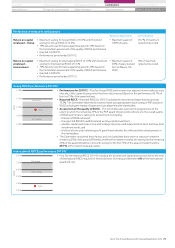
Performance measures and payouts
Maximum opportunity 2011/12 payout
Earnings
per share
<_hij'&&ikX`[Yjjej^[WY^_[l[c[dje\
underlying diluted EPS growth of at least RPI plus
9% over three years and the balance vesting for
achieving growth of at least RPI plus 15% over
three years.
=hWdj[Z_d(&&/%'&$
F[h\ehcWdY[f[h_eZ[dZ[Z(&''%'($
I^Wh[efj_edim_j^W\WY[lWbk[
of 200% of salary at the date
ofgrant.
100% of maximum opportunity
vested.
100% vesting
200% vesting
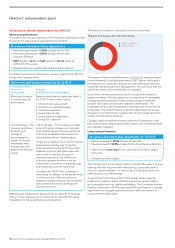
Te s c o
EPS growth above RPI over three years
0%
5%
10%
15%
20% Underlying diluted EPS for 2011/12 excludes the discontinued Japan business and was 37.41p. The
Committee determined, however, that it was appropriate to base vesting of share option awards on
EPS including the impact of Japan to ensure alignment with shareholders.
On this basis, the growth in undiluted EPS above RPI during the performance period exceeded 15%
over three years and these options will therefore vest in fullon the third anniversary of their grant.
Despite the challenges in 2011/12 earnings, performance is still significantly ahead of 2008/9
performance representing significant value creation for shareholders over this period.
The exercise price for awards is 338.4p per share. At the year end the share price was 318.2p and the
share options granted in 2009 were therefore underwater. No value will be delivered to Executives
unless the share price increases significantly above this level.
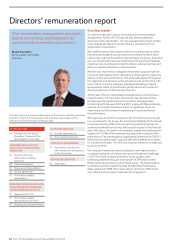
Directors’ remuneration report
72 Tesco PLC Annual Report and Financial Statements 2012