Tesco 2012 Annual Report Download - page 118
Download and view the complete annual report
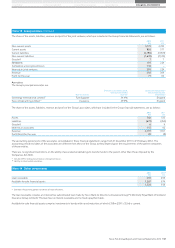
Please find page 118 of the 2012 Tesco annual report below. You can navigate through the pages in the report by either clicking on the pages listed below, or by using the keyword search tool below to find specific information within the annual report.-
 1
1 -
2
-
3
-
4
-
5
-
6
-
7
-
8
-
9
-
10
-
11
-
12
-
13
-
14
-
15
-
16
-
17
-
18
-
19
-
20
-
21
-
22
-
23
-
24
-
25
-
26
-
27
-
28
-
29
-
30
-
31
-
32
-
33
-
34
-
35
-
36
-
37
-
38
-
39
-
40
-
41
-
42
-
43
-
44
-
45
-
46
-
47
-
48
-
49
-
50
-
51
-
52
-
53
-
54
-
55
-
56
-
57
-
58
-
59
-
60
-
61
-
62
-
63
-
64
-
65
-
66
-
67
-
68
-
69
-
70
-
71
-
72
-
73
-
74
-
75
-
76
-
77
-
78
-
79
-
80
-
81
-
82
-
83
-
84
-
85
-
86
-
87
-
88
-
89
-
90
-
91
-
92
-
93
-
94
-
95
-
96
-
97
-
98
-
99
-
100
-
101
-
102
-
103
-
104
-
105
-
106
-
107
-
 108
108 -
 109
109 -
 110
110 -
 111
111 -
 112
112 -
 113
113 -
 114
114 -
 115
115 -
 116
116 -
 117
117 -
 118
118 -
 119
119 -
 120
120 -
 121
121 -
 122
122 -
 123
123 -
 124
124 -
 125
125 -
 126
126 -
 127
127 -
 128
128 -
129
-
130
-
131
-
132
-
133
-
134
-
135
-
136
-
137
-
138
-
139
-
140
-
141
-
142
-
143
-
144
-
145
-
146
-
147
-
148
-
149
-
150
-
151
-
152
-
153
-
154
-
155
-
156
-
157
-
158
 |
 |

Notes to the Group financial statements
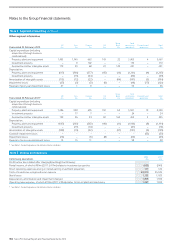
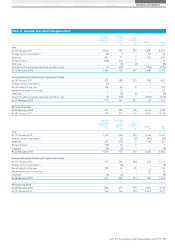
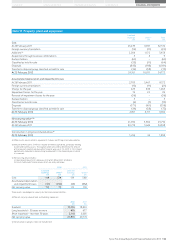
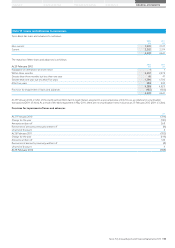
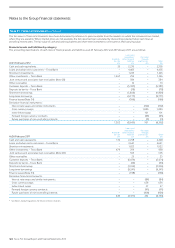
Note 11 Property, plant and equipment continued
Land and
buildings
£m
Other(a)
£m
Total
£m
Cost
At 27 February 2010 23,385 8,398 31,783
Foreign currency translation (257) (153) (410)
Additions(b) 2,577 697 3,274
Acquisitions through business combinations 22 24 46
Reclassification (673) 301 (372)
Classified as held for sale (110) – (110)
Disposals (1,465) (176) (1,641)
At 26 February 2011 23,479 9,091 32,570
Accumulated depreciation and impairment losses
At 27 February 2010 2,700 4,880 7,580
Foreign currency translation (21) (55) (76)
Charge for the year 412 782 1,194
Impairment losses for the year 20 3 23
Reversal of impairment losses for the year (38) – (38)
Reclassification (199) 3 (196)
Classified as held for sale (29) – (29)
Disposals (140) (146) (286)
At 26 February 2011 2,705 5,467 8,172
Net carrying value(c)(d)
At 26 February 2011 20,774 3,624 24,398
At 27 February 2010 20,685 3,518 24,203
Construction in progress included above(e)
At 26 February 2011 1,267 196 1,463
(b) (c) (d) (e) See page 113 for footnotes.
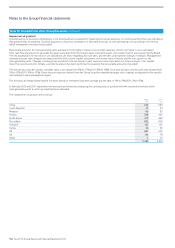
Impairment of property, plant and equipment
The Group has determined that for the purposes of impairment testing, each store is a cash-generating unit. Cash-generating units are tested for
impairment if there are indications of impairment at the balance sheet date.
Recoverable amounts for cash-generating units are mainly based on value in use, which is generally calculated from cash flow projections for five to
twenty years using data from the Group’s latest internal forecasts, the results of which are reviewed by the Board. The key assumptions for the value in
use calculations are those regarding discount rates, growth rates and expected changes in margins. Management estimate discount rates using pre-tax rates
that reflect the current market assessment of the time value of money and the risks specific to the cash-generating units. Changes in selling prices and
direct costs are based on past experience and expectations of future changes in the market.
The forecasts are extrapolated beyond five years based on estimated long-term growth rates of 1% to 5% (2011: 2% to 5%).
The pre-tax discount rates used to calculate value in use range from 6% to 17% (2011: 6% to 14%) depending on the specific conditions in which each
store operates. On a post-tax basis, the discount rates ranged from 5% to 13% (2011: 6% to 12%). These discount rates are derived from the Group’s
post-tax weighted average cost of capital, as adjusted for the specific risks relating to each geographical region.
The impairment losses relate to stores whose recoverable amounts do not exceed the asset carrying values. In all cases, impairment losses arose due
to stores performing below forecasted trading levels.
The reversal of previous impairment losses arose principally due to improvements in stores’ performances over the last year, which increased the net
present value of future cash flows.
114 Tesco PLC Annual Report and Financial Statements 2012