Tesco 2012 Annual Report Download - page 125
Download and view the complete annual report
Please find page 125 of the 2012 Tesco annual report below. You can navigate through the pages in the report by either clicking on the pages listed below, or by using the keyword search tool below to find specific information within the annual report.-
 1
1 -
2
-
3
-
4
-
5
-
6
-
7
-
8
-
9
-
10
-
11
-
12
-
13
-
14
-
15
-
16
-
17
-
18
-
19
-
20
-
21
-
22
-
23
-
24
-
25
-
26
-
27
-
28
-
29
-
30
-
31
-
32
-
33
-
34
-
35
-
36
-
37
-
38
-
39
-
40
-
41
-
42
-
43
-
44
-
45
-
46
-
47
-
48
-
49
-
50
-
51
-
52
-
53
-
54
-
55
-
56
-
57
-
58
-
59
-
60
-
61
-
62
-
63
-
64
-
65
-
66
-
67
-
68
-
69
-
70
-
71
-
72
-
73
-
74
-
75
-
76
-
77
-
78
-
79
-
80
-
81
-
82
-
83
-
84
-
85
-
86
-
87
-
88
-
89
-
90
-
91
-
92
-
93
-
94
-
95
-
96
-
97
-
98
-
99
-
100
-
101
-
102
-
103
-
104
-
105
-
106
-
107
-
108
-
109
-
110
-
111
-
112
-
113
-
114
-
 115
115 -
 116
116 -
 117
117 -
 118
118 -
 119
119 -
 120
120 -
 121
121 -
 122
122 -
 123
123 -
 124
124 -
 125
125 -
 126
126 -
 127
127 -
 128
128 -
 129
129 -
 130
130 -
 131
131 -
 132
132 -
 133
133 -
 134
134 -
 135
135 -
136
-
137
-
138
-
139
-
140
-
141
-
142
-
143
-
144
-
145
-
146
-
147
-
148
-
149
-
150
-
151
-
152
-
153
-
154
-
155
-
156
-
157
-
158
 |
 |

STRATEGIC REVIEW PERFORMANCE REVIEW GOVERNANCE FINANCIAL STATEMENTS
OVERVIEW
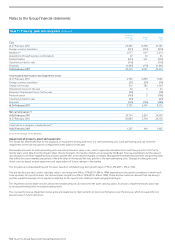
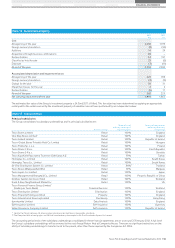
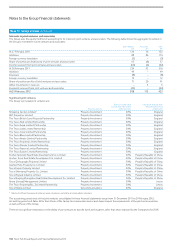
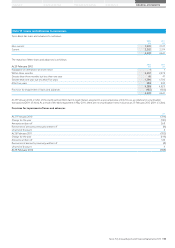
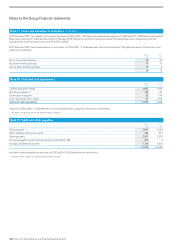
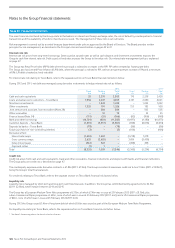
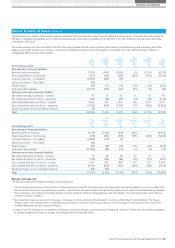
Note 20 Borrowings
Current
Par value
Maturity
year
2012
£m
2011
£m
Bank loans and overdrafts – – 399 437
Loan from joint ventures (Note 28) – – 16 26
3.875% MTN €389m 2011 – 346
LIBOR + 0.5% Bond – Tesco Bank £225m 2012 – 224
5.625% MTN €1,500m 2012 1,304 –
Other MTNs – – 87 303
Finance leases (Note 34) – – 32 50
1,838 1,386
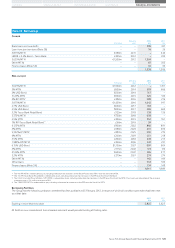
Non-current
Par value
Maturity
year
2012
£m
2011
£m
5.625% MTN €1,500m 2012 – 1,317
5% MTN £600m 2014 619 606
2% USD Bond $500m 2014 317 –
5.125% MTN €600m 2015 526 510
4% RPI MTN*£282m 2016 288 276
5.875% MTN €1,039m 2016 1,042 997
2.7% USD Bond $500m 2017 318 –
5.5% USD Bond $850m 2017 659 600
5.2% Tesco Bank Retail Bond £125m 2018 138 126
3.375% MTN €750m 2018 638 –
5.5% MTN £350m 2019 352 351
1% RPI Tesco Bank Retail Bond** £60m 2019 59 –
6.125% MTN £900m 2022 892 891
5% MTN £389m 2023 401 390
3.322% LPI MTN†£287m 2025 290 279
6% MTN £200m 2029 251 218
5.5% MTN £200m 2033 249 215
1.982% RPI MTN±£240m 2036 242 231
6.15% USD Bond $1,150m 2037 897 804
5% MTN £173m 2042 174 174
5.125% MTN €600m 2047 635 577
5.2% MTN £279m 2057 274 274
Other MTNs –– 162 169
Other loans –– 354 536
Finance leases (Note 34) –– 134 148
9,911 9,689
* The 4% RPI MTN is redeemable at par, including indexation for increases in the Retail Price Index (‘RPI’) over the life of the MTN.
** The 1% RPI Tesco Bank Retail Bond is redeemable at par, including indexation for increases in the RPI over the life of the Bond.
† The 3.322% Limited Price Inflation (‘LPI’) MTN is redeemable at par, including indexation for increases in the RPI over the life of the MTN. The maximum indexation of the principal
in any one year is 5%, with a minimum of 0%.
± The 1.982% RPI MTN is redeemable at par, including indexation for increases in the RPI over the life of the MTN.
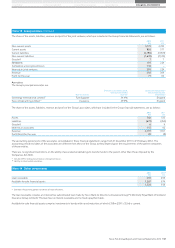
Borrowing facilities
The Group has the following undrawn committed facilities available at 25 February 2012, in respect of which all conditions precedent had been met
as at that date:
2012
£m
2011
£m
Expiring in more than two years 2,825 2,825
All facilities incur commitment fees at market rates and would provide funding at floating rates.
Tesco PLC Annual Report and Financial Statements 2012 121