Tesco 2012 Annual Report Download - page 33
Download and view the complete annual report
Please find page 33 of the 2012 Tesco annual report below. You can navigate through the pages in the report by either clicking on the pages listed below, or by using the keyword search tool below to find specific information within the annual report.-
 1
1 -
2
-
3
-
4
-
5
-
6
-
7
-
8
-
9
-
10
-
11
-
12
-
13
-
14
-
15
-
16
-
17
-
18
-
19
-
20
-
21
-
22
-
 23
23 -
 24
24 -
 25
25 -
 26
26 -
 27
27 -
 28
28 -
 29
29 -
 30
30 -
 31
31 -
 32
32 -
 33
33 -
 34
34 -
 35
35 -
 36
36 -
 37
37 -
 38
38 -
 39
39 -
 40
40 -
 41
41 -
 42
42 -
 43
43 -
44
-
45
-
46
-
47
-
48
-
49
-
50
-
51
-
52
-
53
-
54
-
55
-
56
-
57
-
58
-
59
-
60
-
61
-
62
-
63
-
64
-
65
-
66
-
67
-
68
-
69
-
70
-
71
-
72
-
73
-
74
-
75
-
76
-
77
-
78
-
79
-
80
-
81
-
82
-
83
-
84
-
85
-
86
-
87
-
88
-
89
-
90
-
91
-
92
-
93
-
94
-
95
-
96
-
97
-
98
-
99
-
100
-
101
-
102
-
103
-
104
-
105
-
106
-
107
-
108
-
109
-
110
-
111
-
112
-
113
-
114
-
115
-
116
-
117
-
118
-
119
-
120
-
121
-
122
-
123
-
124
-
125
-
126
-
127
-
128
-
129
-
130
-
131
-
132
-
133
-
134
-
135
-
136
-
137
-
138
-
139
-
140
-
141
-
142
-
143
-
144
-
145
-
146
-
147
-
148
-
149
-
150
-
151
-
152
-
153
-
154
-
155
-
156
-
157
-
158
 |
 |

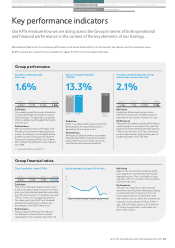
Our KPIs measure how we are doing across the Group in terms of both operational
and financial performance in the context of the key elements of our strategy.
More detailed definitions for our Group performance and Group financial KPIs can be found in the glossary on the inside back cover.
All KPIs exclude the results from our operation in Japan for 2011/12 unless stated otherwise.
Group performance
* Restated for IFRS 2 and IFRIC 13.
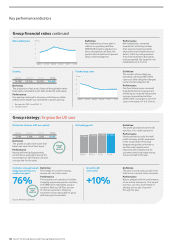
Group financial ratios
4
6
8
10
11/1209/1007/0805/0603/0401/02
%
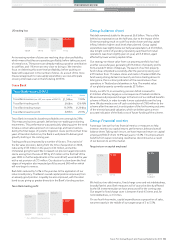
Capital expenditure (‘capex’) % of sales Total shareholder return (‘TSR’)
08/09 09/10 10/11 11/12
8.0% 9.5% 6.7% (3.0)%
Definition
TSR is the notional annualised return from
a share: the percentage change in the share
price, plus the dividends paid and reinvested,
over the last five years. For example, five-year
TSR for 11/12 is the annualised growth in
the share price from 06/07 and dividends
paid and reinvested in Tesco shares, as a
percentage of the 06/07 share price.
Performance
Returns reduced reflecting the effect on
our share price of our decision to invest
significantly in the customer offer in the UK.
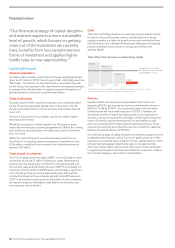
Definition
Capex is the investment in property, plant
and equipment, investment property and
intangible assets. This is divided by Group
sales (inc. VAT, inc. petrol) to show a relative
investment to sales.
Performance
This year we reduced our rate of capital
investment to reflect the challenging trading
environment and increased our focus on
lower capital-intensive investments with
high returns, such as online and convenience.
Last year we set a target of 5% to 5.5% of
sales. We will reduce capex to £3.3 billion in
12/13 and, beyond that, comfortably less
than 5.0% of sales.
1.6%
Growth in underlying profit
before tax
08/09 09/10 10/11 11/12
9.8%* 8.7% 12.3% 1.6%
Definition
Our underlying profit provides information
on the underlying trend and performance
of the business. It is adjusted for a number
of (non-cash) accounting adjustments and
one-off costs.
Performance
We saw modest progress in the year, with
the rate of improvement impacted by two
events: the Hungary crisis tax (£38 million)
and the increase in provision for Payment
Protection Insurance (‘PPI’) in Tesco Bank
(£57 million). Growth before these impacts
was 5.4%.
14.6%
10/11 11/12 14/15
TARGET
12.9% 13.3%
Return on Capital Employed
(‘ROCE’)
13.3%
Definition
ROCE is a relative profit measurement that
demonstrates the return the business is
generating from its gross assets.
Performance
Although our UK performance was weaker
than planned, ROCE improved by 40 basis
points, benefiting from Japan now being
classified as a discontinued operation.
2.1%
Growth in underlying diluted earnings
per share (at a constant tax rate)
08/09 09/10 10/11 11/12
11.0% 7.7% 10. 8% 2.1%
Definition
Underlying diluted earnings per share
(‘EPS’) is the amount of underlying profit,
adjusted for the number of shares in issue.
Performance
The growth in underlying diluted EPS reflects
modest progress in earnings in the year. The
proposed full year dividend per share grew by
2.1%, in line with this, to 14.76p, continuing
our unrivalled record of consecutive years of
dividend growth in the FTSE 100.
Tesco PLC Annual Report and Financial Statements 2012 29
STRATEGIC REVIEW PERFORMANCE REVIEW GOVERNANCE FINANCIAL STATEMENTSOVERVIEW
Key performance indicators Financial review
Key performance indicators