Tesco 2012 Annual Report Download - page 152
Download and view the complete annual report
Please find page 152 of the 2012 Tesco annual report below. You can navigate through the pages in the report by either clicking on the pages listed below, or by using the keyword search tool below to find specific information within the annual report.-
 1
1 -
2
-
3
-
4
-
5
-
6
-
7
-
8
-
9
-
10
-
11
-
12
-
13
-
14
-
15
-
16
-
17
-
18
-
19
-
20
-
21
-
22
-
23
-
24
-
25
-
26
-
27
-
28
-
29
-
30
-
31
-
32
-
33
-
34
-
35
-
36
-
37
-
38
-
39
-
40
-
41
-
42
-
43
-
44
-
45
-
46
-
47
-
48
-
49
-
50
-
51
-
52
-
53
-
54
-
55
-
56
-
57
-
58
-
59
-
60
-
61
-
62
-
63
-
64
-
65
-
66
-
67
-
68
-
69
-
70
-
71
-
72
-
73
-
74
-
75
-
76
-
77
-
78
-
79
-
80
-
81
-
82
-
83
-
84
-
85
-
86
-
87
-
88
-
89
-
90
-
91
-
92
-
93
-
94
-
95
-
96
-
97
-
98
-
99
-
100
-
101
-
102
-
103
-
104
-
105
-
106
-
107
-
108
-
109
-
110
-
111
-
112
-
113
-
114
-
115
-
116
-
117
-
118
-
119
-
120
-
121
-
122
-
123
-
124
-
125
-
126
-
127
-
128
-
129
-
130
-
131
-
132
-
133
-
134
-
135
-
136
-
137
-
138
-
139
-
140
-
141
-
 142
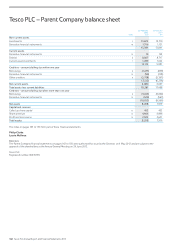
142 -
 143
143 -
 144
144 -
 145
145 -
 146
146 -
 147
147 -
 148
148 -
 149
149 -
 150
150 -
 151
151 -
 152
152 -
 153
153 -
 154
154 -
 155
155 -
 156
156 -
 157
157 -
 158
158
 |
 |

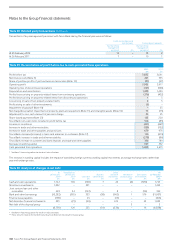
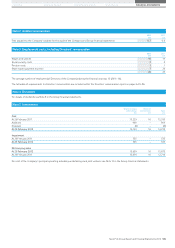
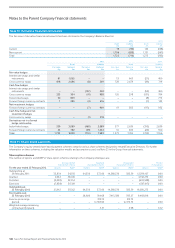
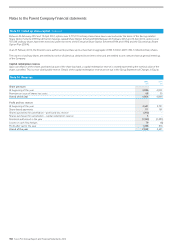
Note 10 Derivative financial instruments
The fair value of derivative financial instruments has been disclosed in the Company’s Balance Sheet as:
2012 2011
Asset
£m
Liability
£m
Asset
£m
Liability
£m
Current 19 (90) 142 (138)
Non-current 1,706 (620) 1,131 (567)
Total 1,725 (710) 1,273 (705)
2012 2011
Asset Liability Asset Liability
Fair value
£m
Notional
£m
Fair value
£m
Notional
£m
Fair value
£m
Notional
£m
Fair value
£m
Notional
£m
Fair value hedges
Interest rate swaps and similar
instruments 81 1,065 – – 13 665 (21) 400
Cross currency swaps 818 2,686 (8) 269 728 2,674 (39) 714
Cash flow hedges
Interest rate swaps and similar
instruments ––(132)400 ––(54)400
Cross currency swaps 233 304 (41) 988 126 298 (151) 784
Index-linked swaps 30 809 – – – – (8) 772
Forward foreign currency contracts 1285 (4)616 –– (1)145
Net investment hedges
Forward foreign currency contracts ––(7)96919 383 (97) 952
Cash flow hedge and net
investment hedges
Cross currency swaps ––(1)318 –– ––
Derivatives not in a formal
hedge relationship
Index-linked swaps 539 3,089 (468) 3,089 377 2,639 (310) 2,639
Forward foreign currency contracts 23 782 (49) 1,034 10 400 (24) 550
Total 1,725 9,020 (710) 7,683 1,273 7,059 (705) 7,356
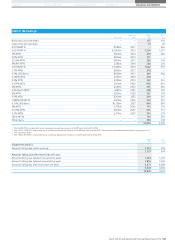
Note 11 Share-based payments
The Company’s equity-settled share-based payment schemes comprise various share schemes designed to reward Executive Directors. For further
information on these schemes, including the valuation models and assumptions used, see Note 25 in the Group financial statements.
Share option schemes
The number of options and WAEP of share option schemes relating to the Company employees are:
For the year ended 25 February 2012
Savings-related
share option scheme
Approved
share option scheme
Unapproved
share option scheme
Nil cost
share options
Options WAEP Options WAEP Options WAEP Options WAEP
Outstanding at
26 February 2011 33,834 342.93 64,330 373.06 14,368,570 385.59 12,399,127 0.00
Granted 4,944 364.00 – – – – 4,742,273 0.00
Forfeited (5,028) 343.54 – – – – (603,508) 0.00
Exercised (7,838) 313.89 – – – – (507,617) 0.00
Outstanding at
25 February 2012 25,912 355.62 64,330 373.06 14,368,570 385.59 16,030,275 0.00
Exercisable as at
25 February 2012 – – 28,600 314.68 7,413,586 395.27 9,468,818 0.00
Exercise price range
(pence) – – –
312.75
to 318.60 –
312.75
to 473.75 – 0.00
Weighted average remaining
contractual life (years) – – – 3.51 – 4.98 – 6.12
Notes to the Parent Company financial statements
148 Tesco PLC Annual Report and Financial Statements 2012