Tesco 2012 Annual Report Download - page 112
Download and view the complete annual report
Please find page 112 of the 2012 Tesco annual report below. You can navigate through the pages in the report by either clicking on the pages listed below, or by using the keyword search tool below to find specific information within the annual report.-
 1
1 -
2
-
3
-
4
-
5
-
6
-
7
-
8
-
9
-
10
-
11
-
12
-
13
-
14
-
15
-
16
-
17
-
18
-
19
-
20
-
21
-
22
-
23
-
24
-
25
-
26
-
27
-
28
-
29
-
30
-
31
-
32
-
33
-
34
-
35
-
36
-
37
-
38
-
39
-
40
-
41
-
42
-
43
-
44
-
45
-
46
-
47
-
48
-
49
-
50
-
51
-
52
-
53
-
54
-
55
-
56
-
57
-
58
-
59
-
60
-
61
-
62
-
63
-
64
-
65
-
66
-
67
-
68
-
69
-
70
-
71
-
72
-
73
-
74
-
75
-
76
-
77
-
78
-
79
-
80
-
81
-
82
-
83
-
84
-
85
-
86
-
87
-
88
-
89
-
90
-
91
-
92
-
93
-
94
-
95
-
96
-
97
-
98
-
99
-
100
-
101
-
 102
102 -
 103
103 -
 104
104 -
 105
105 -
 106
106 -
 107
107 -
 108
108 -
 109
109 -
 110
110 -
 111
111 -
 112
112 -
 113
113 -
 114
114 -
 115
115 -
 116
116 -
 117
117 -
 118
118 -
 119
119 -
 120
120 -
 121
121 -
 122
122 -
123
-
124
-
125
-
126
-
127
-
128
-
129
-
130
-
131
-
132
-
133
-
134
-
135
-
136
-
137
-
138
-
139
-
140
-
141
-
142
-
143
-
144
-
145
-
146
-
147
-
148
-
149
-
150
-
151
-
152
-
153
-
154
-
155
-
156
-
157
-
158
 |
 |

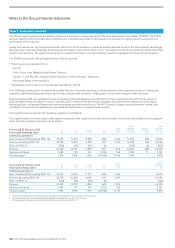
Notes to the Group financial statements
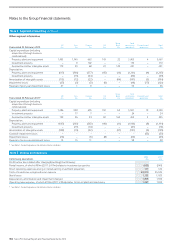
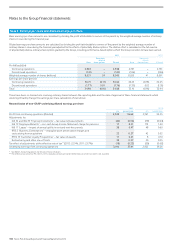
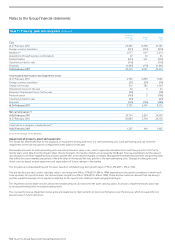
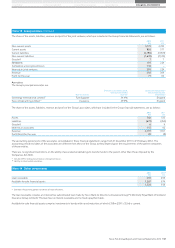
Note 6 Taxation continued
Certain deferred tax assets and liabilities have been offset and analysed as follows:
2012
£m
2011
£m
Deferred tax assets 23 48
Deferred tax liabilities (1,160) (1,094)
(1,137) (1,046)
No deferred tax is recognised on unremitted earnings of overseas subsidiaries and joint ventures, on the grounds that the Group is able to control the
timing of the reversal of these temporary differences and it is probable that they will not reverse in the foreseeable future. The temporary difference
unrecognised at the year end amounted to £3.4bn (2011: £3.0bn). The deferred tax on unremitted earnings at 25 February 2012 is estimated to be
£161m (2011: £90m) which relates to taxes payable on repatriation and dividend withholding taxes levied by overseas tax jurisdictions. UK tax legislation
relating to company distributions provides for exemption from tax for most repatriated profits, subject to certain exceptions.
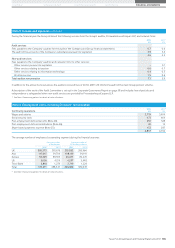
Unrecognised deferred tax assets
Deferred tax assets in relation to continuing operations have not been recognised in respect of the following items (because it is not probable that future
taxable profits will be available against which the Group can utilise the benefits):
2012
£m
2011
£m
Deductible temporary differences 29 19
Tax losses 484 403
513 422
As at 25 February 2012, the Group has unused trading tax losses from continuing operations of £1,523m (2011: £1,309m) available for offset against
future profits. A deferred tax asset has been recognised in respect of £110m (2011: £109m) of such losses. No deferred tax asset has been recognised
inrespect of the remaining £1,413m (2011: £1,200m) due to the unpredictability of future profit streams. Included in unrecognised tax losses are losses
of £479m that will expire in 2016 (2011: £390m in 2015) and £879m that will expire between 2017 and 2032 (2011: £744m between 2016 and 2031).
Other losses will be carried forward indefinitely.
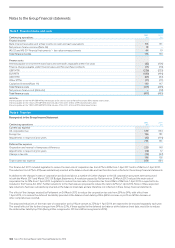
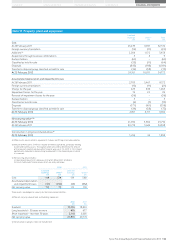
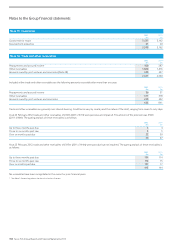
Note 7 Discontinued operations and non-current assets classified as held for sale
25 February
2012
£m
26 February
2011
£m
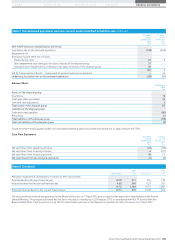
Assets of the disposal group 65 –
Non-current assets classified as held for sale 445 431
Total assets of the disposal group and non-current assets classified as held for sale 510 431
Total liabilities of the disposal group (69) –
Total net assets classified as held for sale 441 431
The non-current assets held for sale consist mainly of properties in the UK and Thailand due to be sold within one year.
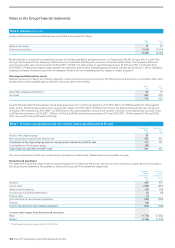
Discontinued operations
The tables below show the results of the discontinued operations in relation to the Group’s decision to sell its operations in Japan which are included in
the Group Income Statement, Group Balance Sheet and Group Cash Flow Statement respectively.
52 weeks
ended
25 February
2012
£m
52 weeks
ended
26 February
2011
£m
Revenue 436 476
Cost of sales*(539) (541)
Administrative expenses (23) (36)
Loss arising on property related items (1) (5)
Finance costs (1) –
Loss before tax on discontinued operations (128) (106)
Taxation (14) –
Loss for the year from discontinued operations (142) (106)
Loss per share impact from discontinued operations
Basic (1.77p) (1.33p)
Diluted (1.76p) (1.31p)
* Including operating lease expense of £27m (2011: £32m).
108 Tesco PLC Annual Report and Financial Statements 2012