Tesco 2012 Annual Report Download - page 117
Download and view the complete annual report
Please find page 117 of the 2012 Tesco annual report below. You can navigate through the pages in the report by either clicking on the pages listed below, or by using the keyword search tool below to find specific information within the annual report.-
 1
1 -
2
-
3
-
4
-
5
-
6
-
7
-
8
-
9
-
10
-
11
-
12
-
13
-
14
-
15
-
16
-
17
-
18
-
19
-
20
-
21
-
22
-
23
-
24
-
25
-
26
-
27
-
28
-
29
-
30
-
31
-
32
-
33
-
34
-
35
-
36
-
37
-
38
-
39
-
40
-
41
-
42
-
43
-
44
-
45
-
46
-
47
-
48
-
49
-
50
-
51
-
52
-
53
-
54
-
55
-
56
-
57
-
58
-
59
-
60
-
61
-
62
-
63
-
64
-
65
-
66
-
67
-
68
-
69
-
70
-
71
-
72
-
73
-
74
-
75
-
76
-
77
-
78
-
79
-
80
-
81
-
82
-
83
-
84
-
85
-
86
-
87
-
88
-
89
-
90
-
91
-
92
-
93
-
94
-
95
-
96
-
97
-
98
-
99
-
100
-
101
-
102
-
103
-
104
-
105
-
106
-
 107
107 -
 108
108 -
 109
109 -
 110
110 -
 111
111 -
 112
112 -
 113
113 -
 114
114 -
 115
115 -
 116
116 -
 117
117 -
 118
118 -
 119
119 -
 120
120 -
 121
121 -
 122
122 -
 123
123 -
 124
124 -
 125
125 -
 126
126 -
 127
127 -
128
-
129
-
130
-
131
-
132
-
133
-
134
-
135
-
136
-
137
-
138
-
139
-
140
-
141
-
142
-
143
-
144
-
145
-
146
-
147
-
148
-
149
-
150
-
151
-
152
-
153
-
154
-
155
-
156
-
157
-
158
 |
 |

STRATEGIC REVIEW PERFORMANCE REVIEW GOVERNANCE FINANCIAL STATEMENTS
OVERVIEW
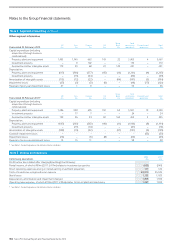
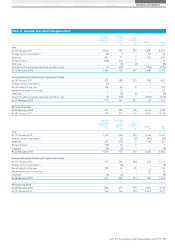
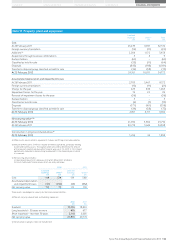
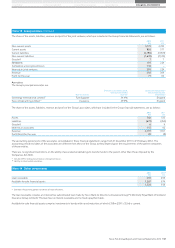
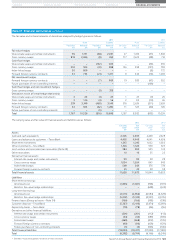
Note 11 Property, plant and equipment
Land and
buildings
£m
Other(a)
£m
Total
£m
Cost
At 26 February 2011 23,479 9,091 32,570
Foreign currency translation (14) (11) (25)
Additions(b) 2,286 1,172 3,458
Acquisitions through business combinations 3 6 9
Reclassification (63) – (63)
Classified as held for sale (53) (11) (64)
Disposals (843) (198) (1,041)
Transfer to disposal group classified as held for sale (34) (38) (72)
At 25 February 2012 24,761 10,011 34,772
Accumulated depreciation and impairment losses
At 26 February 2011 2,705 5,467 8,172
Foreign currency translation (10) (11) (21)
Charge for the year 429 836 1,265
Impairment losses for the year 74 25 99
Reversal of impairment losses for the year (36) – (36)
Reclassification 5 – 5
Classified as held for sale (5) (7) (12)
Disposals (177) (161) (338)
Transfer to disposal group classified as held for sale (34) (38) (72)
At 25 February 2012 2,951 6,111 9,062
Net carrying value(c)(d)
At 25 February 2012 21,810 3,900 25,710
At 26 February 2011 20,774 3,624 24,398
Construction in progress included above(e)
At 25 February 2012 1,246 44 1,290
(a) Other assets consist of plant, equipment, fixtures and fittings and motor vehicles.
(b) Includes £140m (2011: £147m) in respect of interest capitalised, principally relating
to land and building assets. The capitalisation rate used to determine the amount
of finance costs capitalised during the financial year was 5.1% (2011: 5.1%). Interest
capitalised is deducted in determining taxable profit in the financial year in which
it is incurred.
(c) Net carrying value includes:
(i) Capitalised interest at 25 February 2012 of £1,185m (2011: £1,084m).
(ii) Assets held under finance leases which are analysed below:
2012 2011
Land and
buildings
£m
Other(a)
£m
Land and
buildings
£m
Other(a)
£m
Cost 149 574 139 580
Accumulated depreciation
and impairment losses (37) (495) (24) (462)
Net carrying value 112 79 115 118
These assets are pledged as security for the finance lease liabilities.
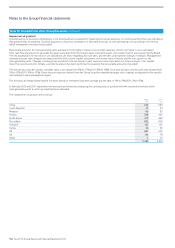
(d) The net carrying value of land and buildings comprises:
2012
£m
2011
£m
Freehold 19,016 18,094
Long leasehold – 50 years or more 676 677
Short leasehold – less than 50 years 2,118 2,003
Net carrying value 21,810 20,774
(e) Construction in progress does not include land.
Tesco PLC Annual Report and Financial Statements 2012 113