Tesco 2012 Annual Report Download - page 151
Download and view the complete annual report
Please find page 151 of the 2012 Tesco annual report below. You can navigate through the pages in the report by either clicking on the pages listed below, or by using the keyword search tool below to find specific information within the annual report.-
 1
1 -
2
-
3
-
4
-
5
-
6
-
7
-
8
-
9
-
10
-
11
-
12
-
13
-
14
-
15
-
16
-
17
-
18
-
19
-
20
-
21
-
22
-
23
-
24
-
25
-
26
-
27
-
28
-
29
-
30
-
31
-
32
-
33
-
34
-
35
-
36
-
37
-
38
-
39
-
40
-
41
-
42
-
43
-
44
-
45
-
46
-
47
-
48
-
49
-
50
-
51
-
52
-
53
-
54
-
55
-
56
-
57
-
58
-
59
-
60
-
61
-
62
-
63
-
64
-
65
-
66
-
67
-
68
-
69
-
70
-
71
-
72
-
73
-
74
-
75
-
76
-
77
-
78
-
79
-
80
-
81
-
82
-
83
-
84
-
85
-
86
-
87
-
88
-
89
-
90
-
91
-
92
-
93
-
94
-
95
-
96
-
97
-
98
-
99
-
100
-
101
-
102
-
103
-
104
-
105
-
106
-
107
-
108
-
109
-
110
-
111
-
112
-
113
-
114
-
115
-
116
-
117
-
118
-
119
-
120
-
121
-
122
-
123
-
124
-
125
-
126
-
127
-
128
-
129
-
130
-
131
-
132
-
133
-
134
-
135
-
136
-
137
-
138
-
139
-
140
-
 141
141 -
 142
142 -
 143
143 -
 144
144 -
 145
145 -
 146
146 -
 147
147 -
 148
148 -
 149
149 -
 150
150 -
 151
151 -
 152
152 -
 153
153 -
 154
154 -
 155
155 -
 156
156 -
 157
157 -
 158
158
 |
 |

STRATEGIC REVIEW PERFORMANCE REVIEW GOVERNANCE FINANCIAL STATEMENTS
OVERVIEW
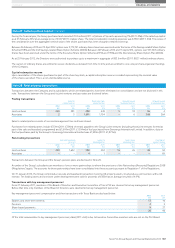
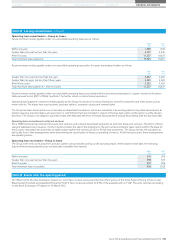
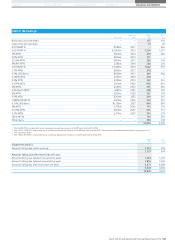
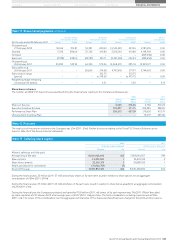
Note 9 Borrowings
Par value
Maturity
year
2012
£m
2011
£m
Bank loans and overdrafts ––123 101
Loans from joint ventures ––10 20
3.875% MTN €389m 2011 –346
5.625% MTN €1,500m 2012 1,304 1,317
5% MTN £600m 2014 619 606
2.0% MTN $500m 2014 317 –
5.125% MTN €600m 2015 526 510
4% RPI MTN* £282m 2016 288 276
5.875% MTN €1,039m 2016 1,042 997
2.7% MTN $500m 2017 318 –
5.5% USD Bond $850m 2017 659 600
3.455% MTN €750m 2018 638 –
5.5% MTN £350m 2019 352 351
6.125% MTN £900m 2022 892 891
5% MTN £389m 2023 401 390
3.322% LPI MTN** £287m 2025 290 279
6% MTN £200m 2029 251 218
5.5% MTN £200m 2033 249 215
1.982% RPI MTN†£240m 2036 242 231
6.15% USD Bond $1,150m 2037 896 804
5% MTN £173m 2042 174 174
5.125% MTN €600m 2047 635 577
5.2% MTN £279m 2057 274 274
Other MTNs ––124 281
Other loans ––246 243
10,870 9,701
* The 4% RPI MTN is redeemable at par, including indexation for increases in the RPI over the life of the MTN.
** The 3.322% LPI MTN is redeemable at par, including indexation for increases in the RPI over the life of the MTN. The maximum indexation of the principal in any one year is 5%,
with a minimum of 0%.
† The 1.982% RPI MTN is redeemable at par, including indexation for increases in the RPI over the life of the MTN.
2012
£m
2011
£m
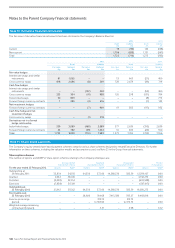
Repayment analysis:
Amounts falling due within one year 1,437 699
1,437 699
Amounts falling due after more than one year:
Amounts falling due between one and two years 1,306 1,321
Amounts falling due between two and five years 1,856 1,401
Amounts falling due after more than five years 6,271 6,280
9,433 9,002
10,870 9,701
Tesco PLC Annual Report and Financial Statements 2012 147