Tesco 2012 Annual Report Download - page 114
Download and view the complete annual report
Please find page 114 of the 2012 Tesco annual report below. You can navigate through the pages in the report by either clicking on the pages listed below, or by using the keyword search tool below to find specific information within the annual report.-
 1
1 -
2
-
3
-
4
-
5
-
6
-
7
-
8
-
9
-
10
-
11
-
12
-
13
-
14
-
15
-
16
-
17
-
18
-
19
-
20
-
21
-
22
-
23
-
24
-
25
-
26
-
27
-
28
-
29
-
30
-
31
-
32
-
33
-
34
-
35
-
36
-
37
-
38
-
39
-
40
-
41
-
42
-
43
-
44
-
45
-
46
-
47
-
48
-
49
-
50
-
51
-
52
-
53
-
54
-
55
-
56
-
57
-
58
-
59
-
60
-
61
-
62
-
63
-
64
-
65
-
66
-
67
-
68
-
69
-
70
-
71
-
72
-
73
-
74
-
75
-
76
-
77
-
78
-
79
-
80
-
81
-
82
-
83
-
84
-
85
-
86
-
87
-
88
-
89
-
90
-
91
-
92
-
93
-
94
-
95
-
96
-
97
-
98
-
99
-
100
-
101
-
102
-
103
-
 104
104 -
 105
105 -
 106
106 -
 107
107 -
 108
108 -
 109
109 -
 110
110 -
 111
111 -
 112
112 -
 113
113 -
 114
114 -
 115
115 -
 116
116 -
 117
117 -
 118
118 -
 119
119 -
 120
120 -
 121
121 -
 122
122 -
 123
123 -
 124
124 -
125
-
126
-
127
-
128
-
129
-
130
-
131
-
132
-
133
-
134
-
135
-
136
-
137
-
138
-
139
-
140
-
141
-
142
-
143
-
144
-
145
-
146
-
147
-
148
-
149
-
150
-
151
-
152
-
153
-
154
-
155
-
156
-
157
-
158
 |
 |

Notes to the Group financial statements
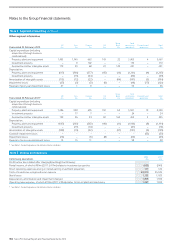
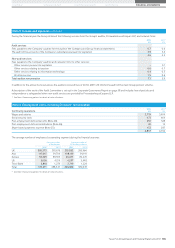
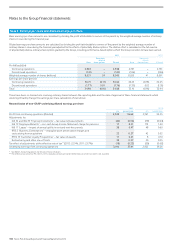
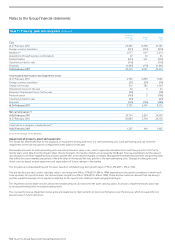
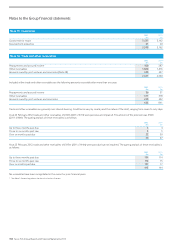
Note 9 Earnings per share and diluted earnings per share
Basic earnings per share amounts are calculated by dividing the profit attributable to owners of the parent by the weighted average number of ordinary
shares in issue during the financial year.
Diluted earnings per share amounts are calculated by dividing the profit attributable to owners of the parent by the weighted average number of
ordinary shares in issue during the financial year adjusted for the effects of potentially dilutive options. The dilutive effect is calculated on the full exercise
of all potentially dilutive ordinary share options granted by the Group, including performance-based options which the Group considers to have been earned.
2012 2011
Basic
Potentially
dilutive
share options Diluted Basic
Potentially
dilutive
share options Diluted
Profit/(loss) (£m)
Continuing operations 2,948 – 2,948 2,761 –2,761
Discontinued operations (142) – (142) (106) –(106)
Weighted average number of shares (millions) 8,021 24 8,045 8,020 41 8,061
Earnings per share (pence)
Continuing operations 36.75 (0.11) 36.64 34.43 (0.18) 34.25
Discontinued operations (1.77) 0.01 (1.76) (1.33) 0.02 (1.31)
Total 34.98 (0.10) 34.88 33.10 (0.16) 32.94
There have been no transactions involving ordinary shares between the reporting date and the date of approval of these financial statements which
would significantly change the earnings per share calculations shown above.
Reconciliation of non-GAAP underlying diluted earnings per share
2012 2011*
£m pence/share £m pence/share
Profit from continuing operations (Diluted) 2,948 36.64 2,761 34.25
Adjustments for:
IAS 32 and IAS 39 ‘Financial Instruments’ – fair value remeasurements (44) (0.54) (19) (0.24)
IAS 19 ‘Employee Benefits’ – non-cash Group Income Statement charge for pensions 17 0.21 113 1.40
IAS 17 ‘Leases’ – impact of annual uplifts in rent and rent-free periods 38 0.47 48 0.60
IFRS 3 ‘Business Combinations’ – intangible asset amortisation charges and
costs arising from acquisitions 22 0.27 42 0.52
IFRIC 13 ‘Customer Loyalty Programmes’ – fair value of awards 17 0.21 80.10
Restructuring and other one-off costs 30 0.37 20 0.25
Tax effect of adjustments at the effective rate of tax** (2012: 22.9%, 2011: 23.7%) (18) (0.22) (50) (0.62)
Underlying earnings from continuing operations 3,010 37.41 2,923 36.26
* See Note 1 Accounting policies for details of reclassifications.
** The effective tax rate of 22.9% (2011: 23.7%) excludes certain permanent differences on which tax relief is not available.
110 Tesco PLC Annual Report and Financial Statements 2012