Tesco 2012 Annual Report Download - page 142
Download and view the complete annual report
Please find page 142 of the 2012 Tesco annual report below. You can navigate through the pages in the report by either clicking on the pages listed below, or by using the keyword search tool below to find specific information within the annual report.-
 1
1 -
2
-
3
-
4
-
5
-
6
-
7
-
8
-
9
-
10
-
11
-
12
-
13
-
14
-
15
-
16
-
17
-
18
-
19
-
20
-
21
-
22
-
23
-
24
-
25
-
26
-
27
-
28
-
29
-
30
-
31
-
32
-
33
-
34
-
35
-
36
-
37
-
38
-
39
-
40
-
41
-
42
-
43
-
44
-
45
-
46
-
47
-
48
-
49
-
50
-
51
-
52
-
53
-
54
-
55
-
56
-
57
-
58
-
59
-
60
-
61
-
62
-
63
-
64
-
65
-
66
-
67
-
68
-
69
-
70
-
71
-
72
-
73
-
74
-
75
-
76
-
77
-
78
-
79
-
80
-
81
-
82
-
83
-
84
-
85
-
86
-
87
-
88
-
89
-
90
-
91
-
92
-
93
-
94
-
95
-
96
-
97
-
98
-
99
-
100
-
101
-
102
-
103
-
104
-
105
-
106
-
107
-
108
-
109
-
110
-
111
-
112
-
113
-
114
-
115
-
116
-
117
-
118
-
119
-
120
-
121
-
122
-
123
-
124
-
125
-
126
-
127
-
128
-
129
-
130
-
131
-
 132
132 -
 133
133 -
 134
134 -
 135
135 -
 136
136 -
 137
137 -
 138
138 -
 139
139 -
 140
140 -
 141
141 -
 142
142 -
 143
143 -
 144
144 -
 145
145 -
 146
146 -
 147
147 -
 148
148 -
 149
149 -
 150
150 -
 151
151 -
 152
152 -
153
-
154
-
155
-
156
-
157
-
158
 |
 |

Notes to the Group financial statements
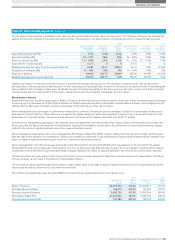
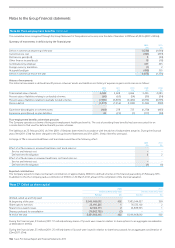
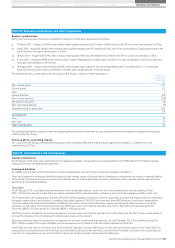
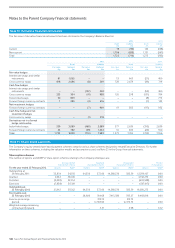
Note 28 Related party transactions continued
Transactions of key management personnel with Tesco Bank during the financial year were as follows:
Credit card and personal
loan balances
Saving deposit accounts
Number of key
management
personnel £m
Number of key
management
personnel £m
At 25 February 2012 12 – 13 2
At 26 February 2011 7–101
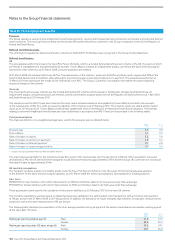
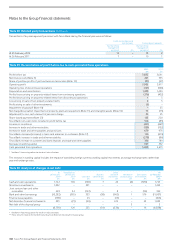
Note 29 Reconciliation of profit before tax to cash generated from operations
2012
£m
2011*
£m
Profit before tax 3,835 3,641
Net finance costs (Note 5) 241 333
Share of post-tax profits of joint ventures and associates (Note 13) (91) (57)
Operating profit 3,985 3,917
Operating loss of discontinued operations (127) (106)
Depreciation and amortisation 1,498 1,420
Profits/losses arising on property-related items from continuing operations (376) (432)
Profits/losses arising on property-related items from discontinued operations 15
Loss arising on sale of non property-related items 43
Profit arising on sale of other investments (5) –
Impairment of goodwill (Note 10) –55
Net charge/(reversal) of impairment of property, plant and equipment (Note 11) and intangible assets (Note 10) 75 (13)
Adjustment for non-cash element of pensions charge 35 95
Share-based payments (Note 25) 125 220
Tesco Bank non-cash items included in profit before tax 166 (83)
Increase in inventories (461) (467)
Increase in trade and other receivables (139) (152)
Increase in trade and other payables and provisions 679 976
Tesco Bank decrease/(increase) in loans and advances to customers (Note 17) 150 (519)
Tesco Bank increase in trade and other receivables (278) (86)
Tesco Bank increase in customer and bank deposits and trade and other payables 356 780
Decrease in working capital 307 532
Cash generated from operations 5,688 5,613
* See Note 1 Accounting policies for details of reclassifications.
The increase in working capital includes the impact of translating foreign currency working capital movements at average exchange rates rather than
year end exchange rates.
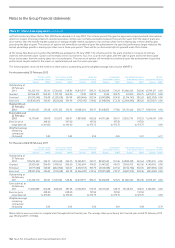
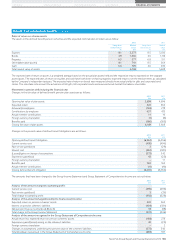
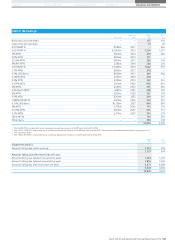
Note 30 Analysis of changes in net debt
At
26 February
2011**
£m
Tesco Bank at
26 February
2011*
£m
Cash flow
£m
Business
combinations
£m
Other
non-cash
movements
£m
Net debt of
disposal group
£m
Elimination
of Tesco Bank
£m
At
25 February
2012**
£m
Cash and cash equivalents 1,722 706 (148) 7 24 (6) (580) 1,725
Short-term investments 1,022 – 221 – – – – 1,243
Joint venture loan and other
receivables 493 34 (142) – 8 – (34) 359
Bank and other borrowings (10,282) (595) 353 (98) (962) 1 576 (11,007)
Finance lease payables (198) – 45 – (13) – – (166)
Net derivative financial instruments 453 (21) (94) – 613 – 52 1,003
Net debt of the disposal group – – –––5–5
(6,790) 124 235 (91) (330) – 14 (6,838)
* See Note 1 Accounting policies for details of reclassifications.
** These amounts relate to the net debt excluding Tesco Bank but including the disposal group.
138 Tesco PLC Annual Report and Financial Statements 2012