Tesco 2012 Annual Report Download - page 108
Download and view the complete annual report
Please find page 108 of the 2012 Tesco annual report below. You can navigate through the pages in the report by either clicking on the pages listed below, or by using the keyword search tool below to find specific information within the annual report.-
 1
1 -
2
-
3
-
4
-
5
-
6
-
7
-
8
-
9
-
10
-
11
-
12
-
13
-
14
-
15
-
16
-
17
-
18
-
19
-
20
-
21
-
22
-
23
-
24
-
25
-
26
-
27
-
28
-
29
-
30
-
31
-
32
-
33
-
34
-
35
-
36
-
37
-
38
-
39
-
40
-
41
-
42
-
43
-
44
-
45
-
46
-
47
-
48
-
49
-
50
-
51
-
52
-
53
-
54
-
55
-
56
-
57
-
58
-
59
-
60
-
61
-
62
-
63
-
64
-
65
-
66
-
67
-
68
-
69
-
70
-
71
-
72
-
73
-
74
-
75
-
76
-
77
-
78
-
79
-
80
-
81
-
82
-
83
-
84
-
85
-
86
-
87
-
88
-
89
-
90
-
91
-
92
-
93
-
94
-
95
-
96
-
97
-
 98
98 -
 99
99 -
 100
100 -
 101
101 -
 102
102 -
 103
103 -
 104
104 -
 105
105 -
 106
106 -
 107
107 -
 108
108 -
 109
109 -
 110
110 -
 111
111 -
 112
112 -
 113
113 -
 114
114 -
 115
115 -
 116
116 -
 117
117 -
 118
118 -
119
-
120
-
121
-
122
-
123
-
124
-
125
-
126
-
127
-
128
-
129
-
130
-
131
-
132
-
133
-
134
-
135
-
136
-
137
-
138
-
139
-
140
-
141
-
142
-
143
-
144
-
145
-
146
-
147
-
148
-
149
-
150
-
151
-
152
-
153
-
154
-
155
-
156
-
157
-
158
 |
 |

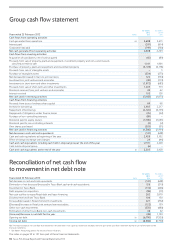
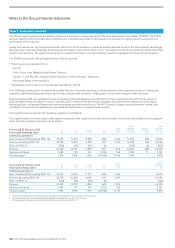
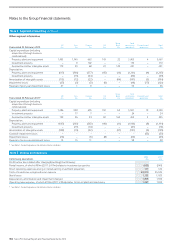
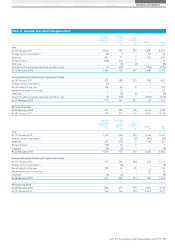
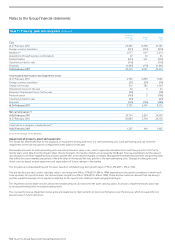
Notes to the Group financial statements
Note 2 Segmental reporting continued
Other segment information
Year ended 25 February 2012 UK
£m
Asia
£m
Europe
£m
US
£m
Tesco
Bank
£m
Total
continuing
operations
Discontinued
operations
Total
£m
Capital expenditure (including
acquisitions through business
combinations):
Property, plant and equipment 1,495 1,140 663 143 22 3,463 4 3,467
Investment property – 8 102 – – 110 – 110
Goodwill and other intangible assets 179 29 68 22 143 441 – 441
Depreciation:
Property, plant and equipment (617) (306) (277) (45) (16) (1,261) (4) (1,265)
Investment property – (15) (24) – – (39) – (39)
Amortisation of intangible assets (113) (12) (22) – (44) (191) (3) (194)
Impairment losses (27) (5) (3) (9) – (44) (77) (121)
Reversal of prior year impairment losses 27 1 8 – – 36 – 36
Year ended 26 February 2011*UK
£m
Asia
£m
Europe
£m
US
£m
Tesco
Bank
£m
Total
continuing
operations
Discontinued
operations
Total
£m
Capital expenditure (including
acquisitions through business
combinations):
Property, plant and equipment 1,486 958 603 192 62 3,301 19 3,320
Investment property – 17 7 – – 24 – 24
Goodwill and other intangible assets 159 26 23 82 163 453 2 455
Depreciation:
Property, plant and equipment (607) (265) (263) (40) (11) (1,186) (8) (1,194)
Investment property – (17) (14) – – (31) – (31)
Amortisation of intangible assets (109) (13) (22) – (47) (191) (4) (195)
Goodwill impairment losses – – – – – – (55) (55)
Impairment losses (14) – (3) (8) – (25) – (25)
Reversal of prior year impairment losses 14 13 11 – – 38 – 38
* See Note 1 Accounting policies for details of reclassifications.
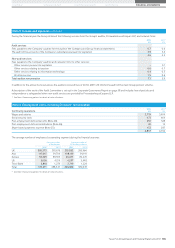
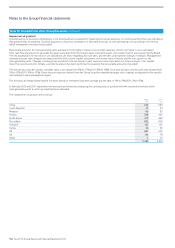
Note 3 Income and expenses
Continuing operations 2012
£m
2011*
£m
Profit before tax is stated after charging/(crediting) the following:
Rental income, of which £499m (2011: £417m) relates to investment properties (605) (541)
Direct operating expenses arising on rental earning investment properties 157 122
Costs of inventories recognised as an expense 48,910 45,529
Stock losses 1,155 1,023
Depreciation, amortisation and impairment charged 1,499 1,395
Operating lease expense, of which £133m (2011: £53m) relates to hire of plant and machinery 1,247 1,033
* See Note 1 Accounting policies for details of reclassifications.
104 Tesco PLC Annual Report and Financial Statements 2012