Suzuki 2010 Annual Report Download - page 50
Download and view the complete annual report
Please find page 50 of the 2010 Suzuki annual report below. You can navigate through the pages in the report by either clicking on the pages listed below, or by using the keyword search tool below to find specific information within the annual report.-
 1
1 -
2
-
3
-
4
-
5
-
6
-
7
-
8
-
9
-
10
-
11
-
12
-
13
-
14
-
15
-
16
-
17
-
18
-
19
-
20
-
21
-
22
-
23
-
24
-
25
-
26
-
27
-
28
-
29
-
30
-
31
-
32
-
33
-
34
-
35
-
36
-
37
-
38
-
39
-
 40
40 -
 41
41 -
 42
42 -
 43
43 -
 44
44 -
 45
45 -
 46
46 -
 47
47 -
 48
48 -
 49
49 -
 50
50 -
 51
51 -
 52
52 -
 53
53 -
 54
54 -
 55
55 -
 56
56
 |
 |

SUZUKI MOTOR CORPORATION 49
Consolidated Financial Statements
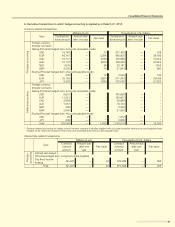
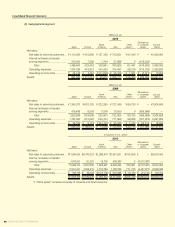
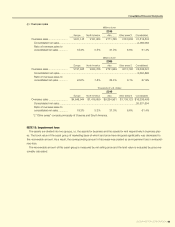
(c) Overseas sales
Millions of yen
2010
Europe North America Asia Other areas*2 Consolidated
Overseas sales .......................... ¥451,145 ¥131,824 ¥771,726 ¥161,808 ¥1,516,504
Consolidated net sales .............................................................................................................2,469,063
Ratio of overseas sales to
consolidated net sales ............. 18.3% 5.3% 31.3% 6.6% 61.4%
Millions of yen
2009
Europe North America Asia Other areas*2 Consolidated
Overseas sales .......................... ¥737,945 ¥234,766 ¥791,829 ¥274,780 ¥2,039,321
Consolidated net sales .............................................................................................................3,004,888
Ratio of overseas sales to
consolidated net sales ............. 24.6% 7.8% 26.4% 9.1% 67.9%
Thousands of U.S. dollars
2010
Europe North America Asia Other areas*2 Consolidated
Overseas sales .......................... $4,848,944 $1,416,859 $8,294,561 $1,739,123 $16,299,489
Consolidated net sales ...........................................................................................................26,537,654
Ratio of overseas sales to
consolidated net sales ............. 18.3% 5.3% 31.3% 6.6% 61.4%
*2 “Other areas” consists principally of Oceania and South America.
NOTE 15:Impairmentloss
The assets are divided into two groups, i.e. the assets for business and the assets for rent respectively in business plac-
es. The book value of the asset group of marketing base of which land price have dropped signicantly was decreased to
the recoverable amount. As a result, the corresponding amount of decrease was posted as an impairment loss in extraordi-
nary loss.
The recoverable amount of this asset group is measured by net selling price and the land value is evaluated by price rea-
sonably calculated.