Suzuki 2010 Annual Report Download - page 25
Download and view the complete annual report
Please find page 25 of the 2010 Suzuki annual report below. You can navigate through the pages in the report by either clicking on the pages listed below, or by using the keyword search tool below to find specific information within the annual report.-
 1
1 -
2
-
3
-
4
-
5
-
6
-
7
-
8
-
9
-
10
-
11
-
12
-
13
-
14
-
 15
15 -
 16
16 -
 17
17 -
 18
18 -
 19
19 -
 20
20 -
 21
21 -
 22
22 -
 23
23 -
 24
24 -
 25
25 -
 26
26 -
 27
27 -
 28
28 -
 29
29 -
 30
30 -
 31
31 -
 32
32 -
 33
33 -
 34
34 -
 35
35 -
36
-
37
-
38
-
39
-
40
-
41
-
42
-
43
-
44
-
45
-
46
-
47
-
48
-
49
-
50
-
51
-
52
-
53
-
54
-
55
-
56
 |
 |

24 SUZUKI MOTOR CORPORATION
Financial Review
(e) Other areas
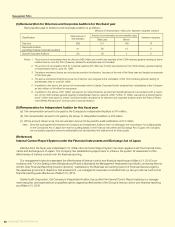
Sales were ¥67.4 billion (75.1% y-o-y) because of the sales reduction in Oceania and Central and South America. Op-
erating income decreased to ¥1.2 billion (70.0% y-o-y) because the reduced operating expenses were unable to cover the
reduced prots by reduced sales and inuence of exchange uctuations.
(3)Selling,generalandadministrativeexpenses
In this scal year, the amount of selling, general and administrative expenses decreased by ¥104.1 billion to ¥507.9 billion,
because the advertising and promotion expenses decreased due to the reduced sales.
(4)Otherincomeandexpenses
In this scal year, the net amount of other income and expenses was a prot of ¥13.1 billion mainly due to nancial account
balance. Compared to the previous scal year, prot increased by ¥9.9 billion mainly due to decreased loss on valuation of secu-
rities.
(5)Outlookofthenextscalyear
For the sales outlook of the next scal year, sales increases are expected in Asia, South and Central America, and Oceania
while sales in Japan, Europe and the U.S. are expected to continue to be low. We will make further efforts for improvement in
every aspect as a group and develop business activities to achieve the results exceeding the consolidated results estimates.
(Forecast of consolidated results)
Net sales ¥2,500.0 billion (up 1.3% y-o-y)
Operating income ¥80.0 billion (up 0.8% y-o-y)
Net income ¥30.0 billion (up 3.8% y-o-y)
Exchange rate 1 US dollar = 90 yen, 1 Euro = 115 yen
* The business forecasts mentioned above are calculated based on currently available information and assumptions and
contain risks and uncertainty. Please note that the future results may greatly vary by the changes of various factors. Those
factors, which may inuence the future results, include economic conditions and the trend of demand in major markets and
the uctuations of foreign exchange rate (mainly Yen/US dollar rate, Yen/Euro rate).
2.Liquidityandcapitalresources
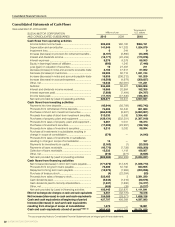
(1)Cashow
For this scal year, cash ow from operating activities increased by ¥326.4 billion (a fund increase of ¥34.2 billion for the
previous scal year), and ¥282.3 billion of funds was used for investing activities including the acquisition of property, plant and
equipment and investments (a fund decrease of ¥262.9 billion for the previous scal year), resulting in an increase of ¥44.1 bil-
lion for free cash ow (a fund decrease of ¥228.7 billion for the previous scal year). For the nancing activities, ¥103.4 billion of
funds increased as a result of the repayment of loans payable in addition to a fund increase by disposal of treasury stocks (a fund
increase of ¥232.9 billion yen for the previous scal year).
As a result, the balance of cash and cash equivalents at the end of this scal year were ¥583.5 billion, up ¥155.7 billion from
the end of the previous scal year.
(2)Demandformoney
During this scal year, the Company and its main subsidiaries and afliates invested a total ¥131.3 billion of capital ex-
penditures (including ¥11.0 billion of capital expenditures of main subsidiaries and afliates) for new model production, R&D
investments, and so on. In the nancing, the long-term loans payable of ¥50 billion was secured in the beginning of this scal
year when the payments of the funds for facilities were concentrated. Further, ¥222.5 billion was secured by way of third-party
allotment of treasury shares to Volkswagen AG in January 2010, of which ¥100 billion was appropriated to the repayment of the
short-term loans payable.
Capital expenditure project for the next scal year is ¥170.0 billion (including ¥10.0 billion of capital expenditures project of
main subsidiaries and afliates). The required fund will be covered mainly by our own funds and others.
3.Signicantaccountingpolicies
For information regarding signicant accounting policies, please refer to the Notes to Consolidated Financial Statements.
4.Risksinoperations
Risks that may affect the management results, stock price and nancial situation of the Group include the followings.
Matters in relation to the future mentioned in the text below are based on our conclusions as of June 29. 2010.