Suzuki 2010 Annual Report Download - page 49
Download and view the complete annual report
Please find page 49 of the 2010 Suzuki annual report below. You can navigate through the pages in the report by either clicking on the pages listed below, or by using the keyword search tool below to find specific information within the annual report.-
 1
1 -
2
-
3
-
4
-
5
-
6
-
7
-
8
-
9
-
10
-
11
-
12
-
13
-
14
-
15
-
16
-
17
-
18
-
19
-
20
-
21
-
22
-
23
-
24
-
25
-
26
-
27
-
28
-
29
-
30
-
31
-
32
-
33
-
34
-
35
-
36
-
37
-
38
-
 39
39 -
 40
40 -
 41
41 -
 42
42 -
 43
43 -
 44
44 -
 45
45 -
 46
46 -
 47
47 -
 48
48 -
 49
49 -
 50
50 -
 51
51 -
 52
52 -
 53
53 -
 54
54 -
 55
55 -
 56
56
 |
 |

48 SUZUKI MOTOR CORPORATION
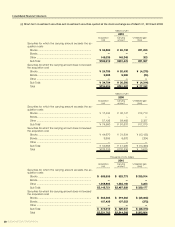
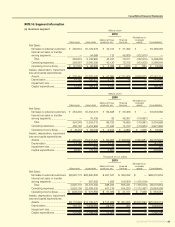
(b) Geographical segment
Consolidated Financial Statements
Millions of yen
2010
Japan Europe
North
America Asia
Other
areas*1
Eliminations
or corporate
assets Consoli-
dated
Net sales:
Net sales to external customers ..
¥1,115,963
¥ 415,890 ¥ 127,136 ¥ 742,631 ¥ 67,440 ¥ —
¥2,469,063
Internal net sales or transfer
among segments ........................
372,500
7,590 1,744 37,996 0 (419,832)
—
Total
1,488,463
423,481 128,881 780,628 67,441 (419,832)
2,469,063
Operating expenses ....................
1,454,336
418,913 140,524 724,461 66,219 (414,760)
2,389,695
Operating income (loss) ...............
¥ 34,126
¥ 4,567 ¥ (11,642)¥ 56,166 ¥ 1,221 ¥ (5,071)
¥ 79,368
Assets:
¥ 995,360
¥ 177,714 ¥ 36,047 ¥ 503,777 ¥ 29,320 ¥ 639,093
¥2,381,314
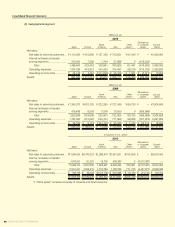
Millions of yen
2009
Japan Europe
North
America Asia
Other
areas*1
Eliminations
or corporate
assets Consoli-
dated
Net sales:
Net sales to external customers ..
¥1,345,370
¥ 610,132 ¥ 222,285 ¥ 737,349 ¥ 89,750 ¥ —
¥3,004,888
Internal net sales or transfer
among segments ........................
478,496
8,503 3,316 15,550 0 (505,866)
—
Total
1,823,866
618,636 225,601 752,900 89,750 (505,866)
3,004,888
Operating expenses ....................
1,795,084
615,525 249,744 717,580 88,006 (537,979)
2,927,962
Operating income (loss) ...............
¥ 28,782
¥ 3,110 ¥ (24,143)¥ 35,320 ¥ 1,744 ¥ 32,112
¥ 76,926
Assets:
¥1,068,052
¥ 180,015 ¥ 74,046 ¥ 410,050 ¥ 23,715 ¥ 401,969
¥2,157,849
Thousands of U.S. dollars
2010
Japan Europe
North
America Asia
Other
areas*1
Eliminations
or corporate
assets Consoli-
dated
Net sales:
Net sales to external customers ..
$11,994,445
$4,470,023 $1,366,474 $7,981,851
$724,859
$
—
$26,537,654
Internal net sales or transfer
among segments ........................
4,003,657
81,581 18,752 408,393
2
(4,512,387
)
—
Total
15,998,103
4,551,605 1,385,227 8,390,244
724,861
(4,512,387
)
26,537,654
Operating expenses ....................
15,631,307
4,502,510 1,510,364 7,786,558
711,736
(4,457,877
)
25,684,599
Operating income (loss) ...............
$ 366,795
$ 49,094 $ (125,136
)
$ 603,686
$ 13,125
$ (54,510
)
$ 853,054
Assets:
$10,698,196
$1,910,091 $ 387,442 $5,414,631
$315,142
$6,869,015
$25,594,519
*1 “Other areas” consists principally of Oceania and South America.