Suzuki 2010 Annual Report Download - page 39
Download and view the complete annual report
Please find page 39 of the 2010 Suzuki annual report below. You can navigate through the pages in the report by either clicking on the pages listed below, or by using the keyword search tool below to find specific information within the annual report.-
 1
1 -
2
-
3
-
4
-
5
-
6
-
7
-
8
-
9
-
10
-
11
-
12
-
13
-
14
-
15
-
16
-
17
-
18
-
19
-
20
-
21
-
22
-
23
-
24
-
25
-
26
-
27
-
28
-
 29
29 -
 30
30 -
 31
31 -
 32
32 -
 33
33 -
 34
34 -
 35
35 -
 36
36 -
 37
37 -
 38
38 -
 39
39 -
 40
40 -
 41
41 -
 42
42 -
 43
43 -
 44
44 -
 45
45 -
 46
46 -
 47
47 -
 48
48 -
 49
49 -
50
-
51
-
52
-
53
-
54
-
55
-
56
 |
 |

38 SUZUKI MOTOR CORPORATION
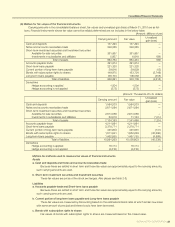
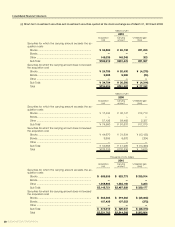
(c) Short-term investment securities and Investment securities quoted at the stock exchange as of March 31, 2010 and 2009
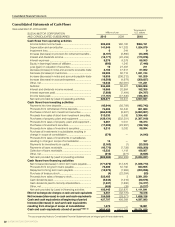
Consolidated Financial Statements
Millions of yen
2010
Acquisition
cost
Carrying
amount
Unrealized gain
(loss)
Securities for which the carrying amount exceeds the ac-
quisition costs
Stocks .......................................................................... ¥54,880 ¥86,133 ¥31,253
Bonds ........................................................................... — — —
Other ............................................................................ 145,039 145,343 303
Sub Total ¥199,919 ¥231,476 ¥31,557
Securities for which the carrying amount does not exceed
the acquisition cost
Stocks .......................................................................... ¥24,709 ¥20,430 ¥(4,279)
Bonds ........................................................................... 9,995 9,960 (34)
Other ............................................................................ — — —
Sub Total ¥34,704 ¥30,390 ¥(4,314)
Total ¥234,624 ¥261,867 ¥27,242
Millions of yen
2009
Acquisition
cost
Carrying
amount
Unrealized gain
(loss)
Securities for which the carrying amount exceeds the ac-
quisition costs
Stocks .......................................................................... ¥ 17,434 ¥ 32,147 ¥14,713
Bonds ........................................................................... — — —
Other ............................................................................ 57,126 59,483 2,357
Sub Total ¥ 74,560 ¥ 91,631 ¥17,070
Securities for which the carrying amount does not exceed
the acquisition cost
Stocks .......................................................................... ¥ 44,670 ¥ 31,534 ¥ (13,135)
Bonds ........................................................................... 9,995 9,670 (324)
Other ............................................................................ — — —
Sub Total ¥ 54,665 ¥ 41,205 ¥ (13,460)
Total ¥129,226 ¥132,836 ¥ 3,610
Thousands of U.S. dollars
2010
Acquisition
cost
Carrying
amount
Unrealized gain
(loss)
Securities for which the carrying amount exceeds the ac-
quisition costs
Stocks .......................................................................... $589,858 $925,773 $335,914
Bonds ........................................................................... — — —
Other ............................................................................ 1,558,893 1,562,156 3,263
Sub Total $2,148,751 $2,487,929 $339,177
Securities for which the carrying amount does not exceed
the acquisition cost
Stocks .......................................................................... $265,583 $219,583 $(46,000)
Bonds ........................................................................... 107,426 107,053 (372)
Other ............................................................................ — — —
Sub Total $373,010 $326,637 $(46,373)
Total $2,521,762 $2,814,566 $292,804