Suzuki 2010 Annual Report Download - page 5
Download and view the complete annual report
Please find page 5 of the 2010 Suzuki annual report below. You can navigate through the pages in the report by either clicking on the pages listed below, or by using the keyword search tool below to find specific information within the annual report.-
 1
1 -
 2
2 -
 3
3 -
 4
4 -
 5
5 -
 6
6 -
 7
7 -
 8
8 -
 9
9 -
 10
10 -
 11
11 -
 12
12 -
 13
13 -
 14
14 -
 15
15 -
 16
16 -
17
-
18
-
19
-
20
-
21
-
22
-
23
-
24
-
25
-
26
-
27
-
28
-
29
-
30
-
31
-
32
-
33
-
34
-
35
-
36
-
37
-
38
-
39
-
40
-
41
-
42
-
43
-
44
-
45
-
46
-
47
-
48
-
49
-
50
-
51
-
52
-
53
-
54
-
55
-
56
 |
 |

4 SUZUKI MOTOR CORPORATION
Years ended March 31
(Millions of yen)
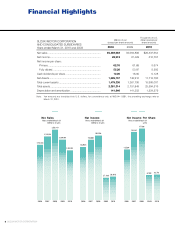
Net Sales
2,469,063
2010
2,746,453
2006
3,163,669
3,004,888
2007
3,502,419
Years ended March 31
(Millions of yen)
Net Income
2006
65,945
2007
75,008
80,254
27,429
Years ended March 31
(yen)
Net Income Per Share
2006
125.64
2007
2008 2009 2009
28,913
2010 2009
2008 2008
169.41
177.96
61.68
2010
62.76
Financial Highlights
SUZUKI MOTOR CORPORATION
AND CONSOLIDATED SUBSIDIARIES
Years ended March 31, 2010 and 2009
Millions of yen
(except per share amounts)
Thousands of U.S.
dollars (except per
share amounts)
2010 2009 2010
Net sales .......................................................................... ¥2,469,063 ¥3,004,888 $26,537,654
Net income ....................................................................... 28,913 27,429 310,767
Net income per share:
Primary ......................................................................... 62.76 61.68 0.674
Fully diluted ................................................................... 55.26 53.97 0.593
Cash dividends per share ................................................. 12.00 16.00 0.128
Net Assets ........................................................................ 1,089,757 742,915 11,712,780
Total current assets .......................................................... 1,479,336 1,267,790 15,900,007
Total assets ...................................................................... 2,381,314 2,157,849 25,594,519
Depreciation and amortization .......................................... 141,846 141,203 1,524,579
Note: Yen amounts are translated into U.S. dollars, for convenience only, at ¥93.04= US$1, the prevailing exchange rate on
March 31, 2010.