Suzuki 2010 Annual Report Download - page 48
Download and view the complete annual report
Please find page 48 of the 2010 Suzuki annual report below. You can navigate through the pages in the report by either clicking on the pages listed below, or by using the keyword search tool below to find specific information within the annual report.-
 1
1 -
2
-
3
-
4
-
5
-
6
-
7
-
8
-
9
-
10
-
11
-
12
-
13
-
14
-
15
-
16
-
17
-
18
-
19
-
20
-
21
-
22
-
23
-
24
-
25
-
26
-
27
-
28
-
29
-
30
-
31
-
32
-
33
-
34
-
35
-
36
-
37
-
 38
38 -
 39
39 -
 40
40 -
 41
41 -
 42
42 -
 43
43 -
 44
44 -
 45
45 -
 46
46 -
 47
47 -
 48
48 -
 49
49 -
 50
50 -
 51
51 -
 52
52 -
 53
53 -
 54
54 -
 55
55 -
 56
56
 |
 |
SUZUKI MOTOR CORPORATION 47
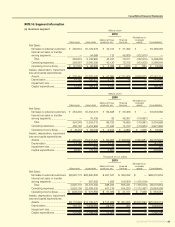
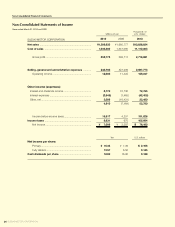
NOTE 14:SegmentInformation
(a) Business segment Millions of yen
2010
Motorcycle Automobile
Marine & Power
products, etc.
Financial
Services
Eliminations or
corporate
assets Consolidated
Net Sales:
Net sales to external customers ¥ 262,910 ¥2,129,276 ¥ 45,314 ¥ 31,562 ¥ — ¥2,469,063
Internal net sales or transfer
among segments ..................... — 54,689 112 48,009 (102,810)—
Total 262,910 2,183,965 45,427 79,571 (102,810)2,469,063
Operating expenses ................. 283,967 2,093,356 40,120 75,755 (103,505)2,389,695
Operating income (loss) ........... ¥ (21,057)¥ 90,608 ¥ 5,306 ¥ 3,815 ¥ 694 ¥ 79,368
Assets, depreciation, impairment
loss and capital expenditures:
Assets ..................................... ¥ 202,444 ¥1,320,542 ¥ 47,995 ¥ 173,408 ¥ 636,923 ¥2,381,314
Depreciation ............................ 14,155 125,571 2,100 18 — 141,846
Impairment loss ....................... — 0 — — — 0
Capital expenditures ................ 12,279 106,819 1,143 1— 120,244
Millions of yen
2009
Motorcycle Automobile
Marine & Power
products, etc.
Financial
Services
Eliminations or
corporate
assets Consolidated
Net Sales:
Net sales to external customers ¥ 454,349 ¥2,453,574 ¥ 66,628 ¥ 30,336 ¥ — ¥3,004,888
Internal net sales or transfer
among segments ..................... — 70,438 92 48,357 (118,887)—
Total 454,349 2,524,012 66,720 78,693 (118,887)3,004,888
Operating expenses ................. 460,765 2,454,963 57,485 74,700 (119,953)2,927,962
Operating income (loss) ........... ¥ (6,416)¥ 69,049 ¥ 9,234 ¥ 3,993 ¥ 1,065 ¥ 76,926
Assets, depreciation, impairment
loss and capital expenditures:
Assets ..................................... ¥ 255,227 ¥1,317,375 ¥ 60,363 ¥ 159,900 ¥ 364,981 ¥2,157,849
Depreciation ............................ 17,192 121,773 2,218 20 — 141,203
Impairment loss ....................... 5 314 23 0 — 344
Capital expenditures ................ 20,947 179,394 3,650 1— 203,994
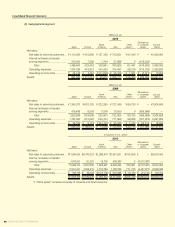
Thousands of U.S. dollars
2010
Motorcycle Automobile
Marine & Power
products, etc.
Financial
Services
Eliminations or
corporate
assets Consolidated
Net Sales:
Net sales to external customers $2,825,775 $22,885,600 $ 487,047 $ 339,232 $ — $26,537,654
Internal net sales or transfer
among segments ..................... — 587,802 1,206 516,009 (1,105,018)—
Total 2,825,775 23,473,402 488,253 855,241 (1,105,018)26,537,654
Operating expenses ................. 3,052,105 22,499,533 431,216 814,230 (1,112,487)25,684,599
Operating income (loss) ........... $ (226,330)$ 973,868 $ 57,036 $ 41,011 $ 7,468 $ 853,054
Assets, depreciation, impairment
loss and capital expenditures:
Assets ..................................... $2,175,884 $14,193,275 $ 515,859 $1,863,806 $6,845,693 $25,594,519
Depreciation ............................ 152,143 1,349,654 22,578 202 — 1,524,579
Impairment loss ....................... — 0 — — — 0
Capital expenditures ................ 131,985 1,148,099 12,295 16 — 1,292,396
Consolidated Financial Statements