Suzuki 2010 Annual Report Download - page 24
Download and view the complete annual report
Please find page 24 of the 2010 Suzuki annual report below. You can navigate through the pages in the report by either clicking on the pages listed below, or by using the keyword search tool below to find specific information within the annual report.-
 1
1 -
2
-
3
-
4
-
5
-
6
-
7
-
8
-
9
-
10
-
11
-
12
-
13
-
 14
14 -
 15
15 -
 16
16 -
 17
17 -
 18
18 -
 19
19 -
 20
20 -
 21
21 -
 22
22 -
 23
23 -
 24
24 -
 25
25 -
 26
26 -
 27
27 -
 28
28 -
 29
29 -
 30
30 -
 31
31 -
 32
32 -
 33
33 -
 34
34 -
35
-
36
-
37
-
38
-
39
-
40
-
41
-
42
-
43
-
44
-
45
-
46
-
47
-
48
-
49
-
50
-
51
-
52
-
53
-
54
-
55
-
56
 |
 |

SUZUKI MOTOR CORPORATION 23
Financial Review
1.Operatingresults
The management environment of the Group for this scal year continues to be in a severe situation with high unemployment rates
continued in Europe and the U.S., while the global economy has not fully recovered although it is gradually recovering because of the
economic recoveries mainly in Asia and economic stimulus measures by each government. The domestic economy has recovered
to some extent with recoveries in export and production based on the overseas economic recovery and the inuences of economic
measures, but it is still in a severe situation with deationary concerns and a high unemployment rate.
Under these circumstances, consolidated sales largely declined for the two consecutive years to ¥2,469.1 billion (82.2% y-o-y)
on account of the reduced domestic and overseas sales volume and uctuations in exchange rates due to yen appreciation. As for
the consolidated prots, the reduced prots caused by a sales decline and exchange inuences were covered by the reduction of
operating expenses mainly by “internal cost reduction initiative” and favorable sales of automobiles in Asia, and prots exceeded
those of the previous scal year with ¥79.4 billion of operating income (103.2% y-o-y) and ¥28.9 billion of net income (105.4% y-o-y).
Meanwhile, non-consolidated sales declined to ¥1,286.6 billion (76.3% y-o-y). However, as for the prots, the reduced prots
caused by a sales decline and exchange inuences were covered by the vigorous reduction of various expenses and prots ex-
ceeded those of the previous scal year with ¥12.0 billion of operating income (105.1% y-o-y) and ¥7.1 billion of net income (215.6%
y-o-y).
(1)Theoperatingresultsbybusinesssegmentation
(a) Motorcycle
In the slowdown of the world economy, domestic and overseas sales were reduced, and sales of the motorcycle busi-
ness were ¥262.9 billion (57.9% y-o-y), also inuenced by exchange uctuations by yen appreciation. As for prot, the Group
posted an operating loss of ¥21.1 billion because the reduced operating expenses were unable to cover the reduced prots
by reduced sales and inuence of exchange uctuations.
(b) Automobile
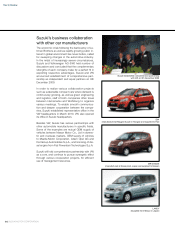
In domestic market, because of the launching of fuel consumption improved cars including “SWIFT,” “MR WAGON,” and
“PALLETE,” the strengthened product and expanded sales efforts such as the launching of new “ALTO,” all the types of which
t the environmentally friendly car dissemination promotion tax system, and the implementation of governmental measures,
sales increased over the previous scal year. On the other hand, overseas sales in India increased because of favorable sales
of new model automobiles including “A-star” and “Ritz (SPLASH for the Japanese name)”, but overseas sales were below
those of the previous scal year on account of exchange uctuations by yen appreciation. As a result, sales for the automobile
business were 2,184.0 billion yen (86.5% y-o-y). Operating income increased to 90.6 billion yen (131.2% y-o-y) because the
cost reduction and the reduced operating expenses covered the reduced prots by reduced sales and inuence of exchange
uctuations.
(c) Marine and Power products, etc
Sales and operating income of marine and power products, etc. business were ¥45.4 billion (68.1% y-o-y) and ¥5.3 billion
(57.5% y-o-y), respectively, on account of global decreasing demand for outboard motors.
(d) Financial Services
Sales and operating income of nancial services business were ¥79.6 billion (101.1% y-o-y) and ¥3.8 billion (95.5% y-o-y),
respectively.
(2)Theoperatingresultsofgeographicalsegmentation
(a) Japan
Sales were ¥1,488.5 billion (81.6% y-o-y) on account of the reduced domestic and export sales. Operating income
increased to ¥34.1 billion (118.6% y-o-y) because the reduced operating expenses covered the reduced prots by reduced
sales and inuence of exchange uctuations.
(b) Europe
Sales declined to ¥423.5 billion (68.5% y-o-y) on account of reduced sales in the economic recession and the inuence of
exchange uctuations by yen appreciation. However, operating income increased by ¥1.5 billion to ¥4.6 billion because of the
reduced operating expenses.
(c) North America
Sales were ¥128.9 billion (57.1% y-o-y) on account of reduced sales in the economic deterioration and credit crunch
started by the nancial crisis and the Group posted an operating loss of ¥11.6 billion. However, operating loss decreased by
¥12.5 billion compared to the previous scal year because of the reduced operating expenses.
(d) Asia
Sales were ¥780.6 billion (103.7% y-o-y) because the increased number of units sold of automobiles by Maruti Suzuki
India Ltd. in India covered the sales decrease in ASEAN and the sales decrease inuenced by exchange uctuations of yen
appreciation. Operating income increased to ¥56.2 billion (159.0% y-o-y) by increased prots of Maruti Suzuki India Ltd.