Suzuki 2010 Annual Report Download - page 28
Download and view the complete annual report
Please find page 28 of the 2010 Suzuki annual report below. You can navigate through the pages in the report by either clicking on the pages listed below, or by using the keyword search tool below to find specific information within the annual report.-
 1
1 -
2
-
3
-
4
-
5
-
6
-
7
-
8
-
9
-
10
-
11
-
12
-
13
-
14
-
15
-
16
-
17
-
 18
18 -
 19
19 -
 20
20 -
 21
21 -
 22
22 -
 23
23 -
 24
24 -
 25
25 -
 26
26 -
 27
27 -
 28
28 -
 29
29 -
 30
30 -
 31
31 -
 32
32 -
 33
33 -
 34
34 -
 35
35 -
 36
36 -
 37
37 -
 38
38 -
39
-
40
-
41
-
42
-
43
-
44
-
45
-
46
-
47
-
48
-
49
-
50
-
51
-
52
-
53
-
54
-
55
-
56
 |
 |

SUZUKI MOTOR CORPORATION 27
SUZUKI MOTOR CORPORATION
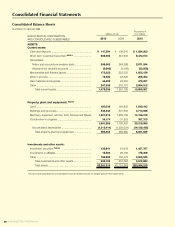
CONSOLIDATED
Millions of yen
(except per share amounts)
Thousands of
U.S. dollars
(except per
share amounts)
Years ended March 31 2010 2009 2008 2007 2006 2010
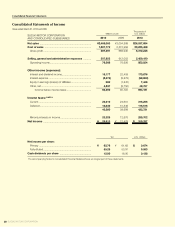
Net sales .................................... ¥2,469,063 ¥3,004,888 ¥3,502,419 ¥3,163,669 ¥2,746,453 $26,537,654
Net income ................................. 28,913 27,429 80,254 75,008 65,945 310,767
Net income per share:
Primary ................................... 62.76 61.68 177.96 169.41 125.64 0.674
Fully diluted ............................. 55.26 53.97 155.89 151.41 122.14 0.593
Cash dividends per share ........... 12.00 16.00 16.00 14.00 11.00 0.128
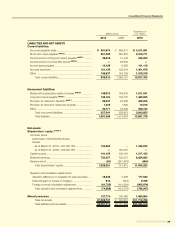
Net assets .................................. 1,089,757 742,915 902,894 855,973 616,770 11,712,780
Total current assets .................... 1,479,336 1,267,790 1,483,038 1,435,405 1,067,709 15,900,007
Total assets ................................ 2,381,314 2,157,849 2,409,165 2,321,441 1,849,714 25,594,519
Depreciation and amortization .... 141,846 141,203 161,600 149,910 126,520 1,524,579
NON-CONSOLIDATED
Millions of yen
(except per share amounts)
Thousands of
U.S. dollars
(except per
share amounts)
Years ended March 31 2010 2009 2008 2007 2006 2010
Net sales .................................... ¥1,286,633 ¥1,685,777 ¥2,031,639 ¥1,939,806 ¥1,690,169 $13,828,824
Net income ................................. 7,086 3,287 40,864 43,054 37,271 76,163
Net income per share:
Primary ................................... 15.38 7.39 90.60 97.23 70.78 0.165
Fully diluted ............................. 13.57 6.50 79.39 86.91 68.82 0.145
Cash dividends per share ........... 12.00 16.00 16.00 14.00 11.00 0.128
Net assets .................................. 673,803 405,434 453,374 429,730 364,127 7,242,084
Total current assets .................... 899,655 705,203 758,848 758,005 518,728 9,669,560
Total assets ................................ 1,625,023 1,402,420 1,430,088 1,381,889 1,082,344 17,465,853
Depreciation and amortization .... 72,359 72,942 76,584 73,881 59,362 777,726
Note: Yen amounts are translated into U.S. dollars for convenience only, at ¥93.04 = US$1, the prevailing exchange rate as of March 31, 2010.
The “Accounting Standard for Presentation of Net Assets in the Balance Sheet” (Accounting Standards Board of Japan; ASBJ Statement No. 5) and
“Guidance on Accounting Standard for Presentation of Net Assets in the Balance Sheet (ASBJ Guidance No. 8) have been applied since the year
ended March 31, 2007.
Five-Year Summary