Suzuki 2010 Annual Report Download - page 30
Download and view the complete annual report
Please find page 30 of the 2010 Suzuki annual report below. You can navigate through the pages in the report by either clicking on the pages listed below, or by using the keyword search tool below to find specific information within the annual report.-
 1
1 -
2
-
3
-
4
-
5
-
6
-
7
-
8
-
9
-
10
-
11
-
12
-
13
-
14
-
15
-
16
-
17
-
18
-
19
-
 20
20 -
 21
21 -
 22
22 -
 23
23 -
 24
24 -
 25
25 -
 26
26 -
 27
27 -
 28
28 -
 29
29 -
 30
30 -
 31
31 -
 32
32 -
 33
33 -
 34
34 -
 35
35 -
 36
36 -
 37
37 -
 38
38 -
 39
39 -
 40
40 -
41
-
42
-
43
-
44
-
45
-
46
-
47
-
48
-
49
-
50
-
51
-
52
-
53
-
54
-
55
-
56
 |
 |

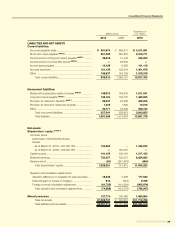
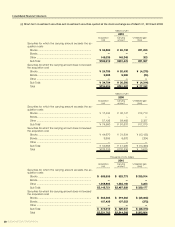
SUZUKI MOTOR CORPORATION 29
Millions of yen
Thousands of
U.S. dollars
2010 2009 2010
LIABILITIESANDNETASSETS
Current liabilities:
Accounts payable-trade ................................................ ¥391,874 ¥ 368,811 $4,211,891
Short-term loans payable *NOTE 5 .................................... 221,320 384,567 2,378,771
Current portion of long term loans payable *NOTE 5 ......... 39,616 14,442 425,803
Current portion of convertible bonds *NOTE 5 ................... —29,605 —
Income taxes payable ................................................... 13,129 6,285 141,119
Accrued expenses ........................................................ 121,136 138,244 1,301,978
Other ............................................................................ 146,837 143,165 1,578,218
Total current liabilities .............................................. 933,915 1,085,121 10,037,783
Noncurrent liabilities:
Bonds with subscription rights to shares *NOTE 5 ............ 149,975 149,975 1,611,941
Long-term loans payable *NOTE 5 .................................... 136,104 102,757 1,462,855
Provision for retirement benets *NOTE 7 .......................... 39,337 42,090 422,805
Provision for directors’ retirement benets ..................... 1,453 1,600 15,619
Other ............................................................................ 30,771 33,390 330,733
Total noncurrent liabilities ........................................ 357,641 329,813 3,843,955
Total liabilities .......................................................... 1,291,556 1,414,934 13,881,738
Net assets:
Shareholders’equity: *NOTE 12
Common stock:
Authorized-1,500,000,000 shares
Issued,
as of March 31, 2010—557,387,304 ..................... 134,803 —1,448,872
as of March 31, 2009—542,647,091 ..................... —120,210 —
Capital surplus .............................................................. 141,153 138,142 1,517,122
Retained earnings ......................................................... 750,357 735,337 8,064,892
Treasury stock ............................................................... (61) (241,878)(664)
Total shareholders’ equity ....................................... 1,026,251 751,812 11,030,223
Valuation and translation adjustments:
Valuation difference on available-for-sale securities..... 16,546 2,309 177,840
Deferred gains or losses on hedges ........................... 910 (324)9,786
Foreign currency translation adjustment ..................... (91,725)(114,364)(985,874)
Total valuation and translation adjustments ............. (74,268)(112,379)(798,247)
Minority interests .......................................................... 137,774 103,482 1,480,804
Total net assets ¥1,089,757 ¥ 742,915 $11,712,780
Total liabilities and net assets .................................. ¥2,381,314 ¥2,157,849 $25,594,519
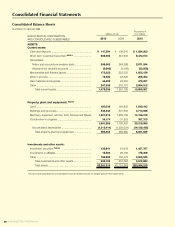
Consolidated Financial Statements