SkyWest Airlines 2012 Annual Report Download - page 97
Download and view the complete annual report
Please find page 97 of the 2012 SkyWest Airlines annual report below. You can navigate through the pages in the report by either clicking on the pages listed below, or by using the keyword search tool below to find specific information within the annual report.-
 1
1 -
2
-
3
-
4
-
5
-
6
-
7
-
8
-
9
-
10
-
11
-
12
-
13
-
14
-
15
-
16
-
17
-
18
-
19
-
20
-
21
-
22
-
23
-
24
-
25
-
26
-
27
-
28
-
29
-
30
-
31
-
32
-
33
-
34
-
35
-
36
-
37
-
38
-
39
-
40
-
41
-
42
-
43
-
44
-
45
-
46
-
47
-
48
-
49
-
50
-
51
-
52
-
53
-
54
-
55
-
56
-
57
-
58
-
59
-
60
-
61
-
62
-
63
-
64
-
65
-
66
-
67
-
68
-
69
-
70
-
71
-
72
-
73
-
74
-
75
-
76
-
77
-
78
-
79
-
80
-
81
-
82
-
83
-
84
-
85
-
86
-
 87
87 -
 88
88 -
 89
89 -
 90
90 -
 91
91 -
 92
92 -
 93
93 -
 94
94 -
 95
95 -
 96
96 -
 97
97 -
 98
98 -
 99
99 -
 100
100 -
 101
101 -
 102
102 -
 103
103 -
 104
104 -
 105
105 -
 106
106 -
 107
107 -
108
-
109
-
110
-
111
-
112
-
113
-
114
-
115
-
116
-
117
-
118
-
119
-
120
-
121
-
122
-
123
-
124
-
125
-
126
-
127
-
128
-
129
-
130
-
131
-
132
-
133
-
134
-
135
-
136
-
137
-
138
-
139
-
140
-
141
-
142
-
143
-
144
-
145
-
146
-
147
-
148
-
149
-
150
-
151
-
152
-
153
-
154
-
155
-
156
-
157
-
158
-
159
-
160
-
161
-
162
-
163
-
164
-
165
-
166
-
167
-
168
-
169
-
170
-
171
-
172
-
173
-
174
-
175
-
176
-
177
-
178
-
179
-
180
 |
 |

SKYWEST, INC. AND SUBSIDIARIES
NOTES TO CONSOLIDATED FINANCIAL STATEMENTS (Continued)
DECEMBER 31, 2012
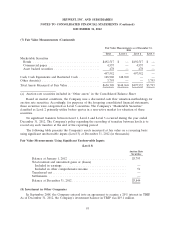
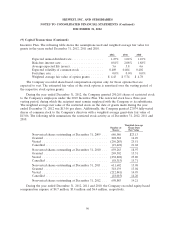
(7) Fair Value Measurements (Continued)
Fair Value Measurements as of December 31,
2011
Total Level 1 Level 2 Level 3
Marketable Securities
Bonds ...................................... $492,517 $ — $492,517 $ —
Commercial paper ............................. 4,557 — 4,557 —
Asset backed securities .......................... 478 — 478 —
497,552 — 497,552 —
Cash, Cash Equivalents and Restricted Cash ............ 148,960 148,960 — —
Other Assets(a) ................................. 3,793 — — 3,793
Total Assets Measured at Fair Value .................. $650,305 $148,960 $497,552 $3,793
(a) Auction rate securities included in ‘‘Other assets’’ in the Consolidated Balance Sheet
Based on market conditions, the Company uses a discounted cash flow valuation methodology for
auction rate securities. Accordingly, for purposes of the foregoing consolidated financial statements,
these securities were categorized as Level 3 securities. The Company’s ‘‘Marketable Securities’’
classified as Level 2 primarily utilize broker quotes in a non-active market for valuation of these
securities.
No significant transfers between Level 1, Level 2 and Level 3 occurred during the year ended
December 31, 2012. The Company’s policy regarding the recording of transfers between levels is to
record any such transfers at the end of the reporting period.
The following table presents the Company’s assets measured at fair value on a recurring basis
using significant unobservable inputs (Level 3) at December 31, 2012 (in thousands):
Fair Value Measurements Using Significant Unobservable Inputs
(Level 3)
Auction Rate
Securities
Balance at January 1, 2012 ................................. $3,793
Total realized and unrealized gains or (losses)
Included in earnings .................................... —
Included in other comprehensive income ..................... 51
Transferred out .......................................... —
Settlements ............................................. —
Balance at December 31, 2012 ............................... $3,844
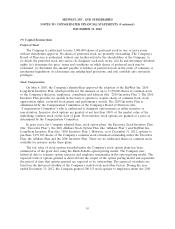
(8) Investment in Other Companies
In September 2008, the Company entered into an agreement to acquire a 20% interest in TRIP.
As of December 31, 2012, the Company’s investment balance in TRIP was $19.1 million.
93