SkyWest Airlines 2012 Annual Report Download - page 60
Download and view the complete annual report
Please find page 60 of the 2012 SkyWest Airlines annual report below. You can navigate through the pages in the report by either clicking on the pages listed below, or by using the keyword search tool below to find specific information within the annual report.-
 1
1 -
2
-
3
-
4
-
5
-
6
-
7
-
8
-
9
-
10
-
11
-
12
-
13
-
14
-
15
-
16
-
17
-
18
-
19
-
20
-
21
-
22
-
23
-
24
-
25
-
26
-
27
-
28
-
29
-
30
-
31
-
32
-
33
-
34
-
35
-
36
-
37
-
38
-
39
-
40
-
41
-
42
-
43
-
44
-
45
-
46
-
47
-
48
-
49
-
 50
50 -
 51
51 -
 52
52 -
 53
53 -
 54
54 -
 55
55 -
 56
56 -
 57
57 -
 58
58 -
 59
59 -
 60
60 -
 61
61 -
 62
62 -
 63
63 -
 64
64 -
 65
65 -
 66
66 -
 67
67 -
 68
68 -
 69
69 -
 70
70 -
71
-
72
-
73
-
74
-
75
-
76
-
77
-
78
-
79
-
80
-
81
-
82
-
83
-
84
-
85
-
86
-
87
-
88
-
89
-
90
-
91
-
92
-
93
-
94
-
95
-
96
-
97
-
98
-
99
-
100
-
101
-
102
-
103
-
104
-
105
-
106
-
107
-
108
-
109
-
110
-
111
-
112
-
113
-
114
-
115
-
116
-
117
-
118
-
119
-
120
-
121
-
122
-
123
-
124
-
125
-
126
-
127
-
128
-
129
-
130
-
131
-
132
-
133
-
134
-
135
-
136
-
137
-
138
-
139
-
140
-
141
-
142
-
143
-
144
-
145
-
146
-
147
-
148
-
149
-
150
-
151
-
152
-
153
-
154
-
155
-
156
-
157
-
158
-
159
-
160
-
161
-
162
-
163
-
164
-
165
-
166
-
167
-
168
-
169
-
170
-
171
-
172
-
173
-
174
-
175
-
176
-
177
-
178
-
179
-
180
 |
 |

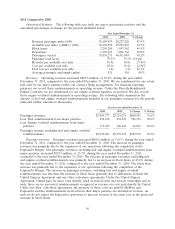
2011 Compared to 2010
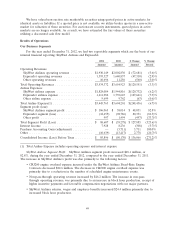
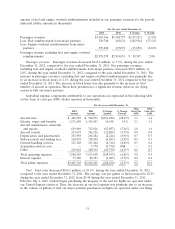
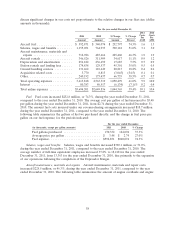
Operational Statistics. The following table sets forth our major operational statistics and the
associated percentages-of-change for the periods identified below.
Year Ended December 31,
2011 2010 % Change
Revenue passenger miles (000) ............. 29,109,039 20,227,220 43.9%
Available seat miles (‘‘ASMs’’) (000) ......... 36,698,859 25,503,845 43.9%
Block hours ........................... 2,250,280 1,547,562 45.4%
Departures ........................... 1,390,523 1,001,766 38.8%
Passengers carried ...................... 55,836,271 40,411,089 38.2%
Passenger load factor .................... 79.3% 79.3% 0.0 pts
Revenue per available seat mile ............ 10.0¢ 10.8¢ (7.4)%
Cost per available seat mile ............... 10.1¢ 10.4¢ (2.9)%
Fuel cost per available seat mile ............ 1.6¢ 1.3¢ 23.1%
Average passenger trip length (miles) ........ 521 501 4.0%
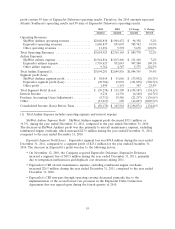
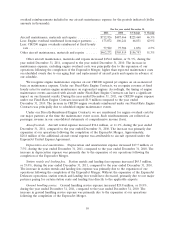
Revenues. Operating revenues increased $889.8 million, or 32.2%, during the year ended
December 31, 2011, compared to the year ended December 31, 2010. We are reimbursed for our actual
fuel costs by our major partners under our contract flying arrangements. For financial reporting
purposes, we record these reimbursements as operating revenue. Under the Directly-Reimbursed
Engine Contracts, we are reimbursed for our engine overhaul expenses as incurred. We also record
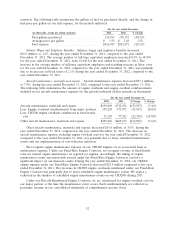
those engine overhaul reimbursements as operating revenue. The following table summarizes the
amount of fuel and engine overhaul reimbursements included in our passenger revenues for the periods
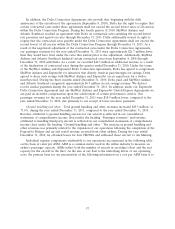
indicated (dollar amounts in thousands).
For the year ended December 31,
2011 2010 $ Change % Change
Passenger revenues ........................... $3,584,777 $2,724,276 $860,501 31.6%
Less: Fuel reimbursement from major partners ....... 492,674 258,523 234,151 90.6%
Less: Engine overhaul reimbursement from major
partners ................................. 173,072 106,241 66,831 62.9%
Passenger revenue excluding fuel and engine overhaul
reimbursements ............................ $2,919,031 $2,359,512 $559,519 23.7%
Passenger revenues. Passenger revenues increased $860.5 million, or 31.6%, during the year ended
December 31, 2011, compared to the year ended December 31, 2010. The increase in passenger
revenues was primarily due to the expansion of our operations following the completion of the
ExpressJet Merger. Our passenger revenues, excluding fuel and engine overhaul reimbursements from
major partners, increased $559.5 million, or 23.7%, during the year ended December 31, 2011,
compared to the year ended December 31, 2010. The increase in passenger revenues, excluding fuel
and engine overhaul reimbursements, was primarily due to an increase in block hours of 45.4% during
the year ended December 31, 2011, compared to the year ended December 31, 2010. The block hour
increase was primarily due to the expansion of our operations following the completion of the
ExpressJet Merger. The increase in passenger revenues, excluding fuel and engine overhaul
reimbursements, was less than the increase in block hours primarily due to differences between the
United Express Agreement and our other code-share agreements. Under the United Express
Agreement, United pays for more costs directly (such as station rents and aircraft ownership) and as
such, there are no associated reimbursements recognized as revenue on costs paid directly by United.
Under our other code-share agreements, the majority of those costs are paid by SkyWest and
ExpressJet and the reimbursements received from their major partners are included in revenue. As
such we do not expect the ExpressJet operations to increase revenue at the same rate as the projected
increase in block hours.
56