SkyWest Airlines 2012 Annual Report Download - page 46
Download and view the complete annual report
Please find page 46 of the 2012 SkyWest Airlines annual report below. You can navigate through the pages in the report by either clicking on the pages listed below, or by using the keyword search tool below to find specific information within the annual report.-
 1
1 -
2
-
3
-
4
-
5
-
6
-
7
-
8
-
9
-
10
-
11
-
12
-
13
-
14
-
15
-
16
-
17
-
18
-
19
-
20
-
21
-
22
-
23
-
24
-
25
-
26
-
27
-
28
-
29
-
30
-
31
-
32
-
33
-
34
-
35
-
 36
36 -
 37
37 -
 38
38 -
 39
39 -
 40
40 -
 41
41 -
 42
42 -
 43
43 -
 44
44 -
 45
45 -
 46
46 -
 47
47 -
 48
48 -
 49
49 -
 50
50 -
 51
51 -
 52
52 -
 53
53 -
 54
54 -
 55
55 -
 56
56 -
57
-
58
-
59
-
60
-
61
-
62
-
63
-
64
-
65
-
66
-
67
-
68
-
69
-
70
-
71
-
72
-
73
-
74
-
75
-
76
-
77
-
78
-
79
-
80
-
81
-
82
-
83
-
84
-
85
-
86
-
87
-
88
-
89
-
90
-
91
-
92
-
93
-
94
-
95
-
96
-
97
-
98
-
99
-
100
-
101
-
102
-
103
-
104
-
105
-
106
-
107
-
108
-
109
-
110
-
111
-
112
-
113
-
114
-
115
-
116
-
117
-
118
-
119
-
120
-
121
-
122
-
123
-
124
-
125
-
126
-
127
-
128
-
129
-
130
-
131
-
132
-
133
-
134
-
135
-
136
-
137
-
138
-
139
-
140
-
141
-
142
-
143
-
144
-
145
-
146
-
147
-
148
-
149
-
150
-
151
-
152
-
153
-
154
-
155
-
156
-
157
-
158
-
159
-
160
-
161
-
162
-
163
-
164
-
165
-
166
-
167
-
168
-
169
-
170
-
171
-
172
-
173
-
174
-
175
-
176
-
177
-
178
-
179
-
180
 |
 |

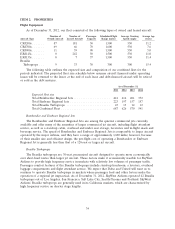
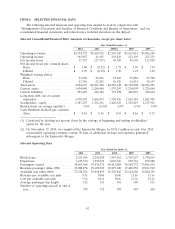
ITEM 6. SELECTED FINANCIAL DATA
The following selected financial and operating data should be read in conjunction with
‘‘Management’s Discussion and Analysis of Financial Condition and Results of Operations,’’ and our
consolidated financial statements and related notes included elsewhere in this Report.
Selected Consolidated Financial Data (amounts in thousands, except per share data):
Year Ended December 31,
2012 2011 2010(2) 2009 2008
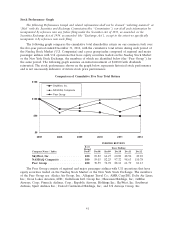
Operating revenues .............. $3,534,372 $3,654,923 $2,765,145 $2,613,614 $3,496,249
Operating income ............... 165,987 41,105 201,826 212,195 255,231
Net income (loss) ............... 51,157 (27,335) 96,350 83,658 112,929
Net income (loss) per common share:
Basic ....................... $ 1.00 $ (0.52) $ 1.73 $ 1.50 $ 1.95
Diluted ..................... $ 0.99 $ (0.52) $ 1.70 1.47 1.93
Weighted average shares:
Basic ....................... 51,090 52,201 55,610 55,854 57,790
Diluted ..................... 51,746 52,201 56,526 56,814 58,633
Total assets .................... 4,254,637 $4,281,908 $4,456,148 $4,310,802 $4,014,291
Current assets .................. 1,434,040 1,280,464 1,379,203 1,254,099 1,220,668
Current liabilities ............... 591,425 624,148 572,278 449,835 386,604
Long-term debt, net of current
maturities ................... 1,470,567 1,606,993 1,738,936 1,816,318 1,681,705
Stockholders’ equity ............. 1,387,175 1,334,261 1,420,923 1,352,219 1,275,521
Return (loss) on average equity(1) . . . 3.8% (2.0)% 6.9% 6.4% 9.0%
Cash dividends declared per common
share ...................... $ 0.16 $ 0.16 $ 0.16 $ 0.16 $ 0.13
(1) Calculated by dividing net income (loss) by the average of beginning and ending stockholders’
equity for the year.
(2) On November 12, 2010, we completed the ExpressJet Merger for $136.5 million in cash. Our 2010
consolidated operating revenues contain 50 days of additional revenue and expenses generated
subsequent to the ExpressJet Merger.
Selected Operating Data
Year Ended December 31,
2012 2011 2010 2009 2008
Block hours .................... 2,297,014 2,250,280 1,547,562 1,363,257 1,376,815
Departures .................... 1,435,512 1,390,523 1,001,766 870,761 872,288
Passengers carried ............... 58,803,690 55,836,271 40,411,089 34,544,772 33,461,819
Revenue passenger miles (000) ...... 30,088,278 29,109,039 20,227,220 17,448,958 17,101,910
Available seat miles (000) ......... 37,278,554 36,698,859 25,503,845 22,142,650 22,020,250
Revenue per available seat mile ..... 9.5¢ 10.0¢ 10.8¢ 11.8¢ 15.9¢
Cost per available seat mile ........ 9.2¢ 10.1¢ 10.4¢ 11.2¢ 15.2¢
Average passenger trip length ....... 512 521 501 505 511
Number of operating aircraft at end of
year ........................ 738 732 704 449 442
42