SkyWest Airlines 2012 Annual Report Download - page 65
Download and view the complete annual report
Please find page 65 of the 2012 SkyWest Airlines annual report below. You can navigate through the pages in the report by either clicking on the pages listed below, or by using the keyword search tool below to find specific information within the annual report.-
 1
1 -
2
-
3
-
4
-
5
-
6
-
7
-
8
-
9
-
10
-
11
-
12
-
13
-
14
-
15
-
16
-
17
-
18
-
19
-
20
-
21
-
22
-
23
-
24
-
25
-
26
-
27
-
28
-
29
-
30
-
31
-
32
-
33
-
34
-
35
-
36
-
37
-
38
-
39
-
40
-
41
-
42
-
43
-
44
-
45
-
46
-
47
-
48
-
49
-
50
-
51
-
52
-
53
-
54
-
 55
55 -
 56
56 -
 57
57 -
 58
58 -
 59
59 -
 60
60 -
 61
61 -
 62
62 -
 63
63 -
 64
64 -
 65
65 -
 66
66 -
 67
67 -
 68
68 -
 69
69 -
 70
70 -
 71
71 -
 72
72 -
 73
73 -
 74
74 -
 75
75 -
76
-
77
-
78
-
79
-
80
-
81
-
82
-
83
-
84
-
85
-
86
-
87
-
88
-
89
-
90
-
91
-
92
-
93
-
94
-
95
-
96
-
97
-
98
-
99
-
100
-
101
-
102
-
103
-
104
-
105
-
106
-
107
-
108
-
109
-
110
-
111
-
112
-
113
-
114
-
115
-
116
-
117
-
118
-
119
-
120
-
121
-
122
-
123
-
124
-
125
-
126
-
127
-
128
-
129
-
130
-
131
-
132
-
133
-
134
-
135
-
136
-
137
-
138
-
139
-
140
-
141
-
142
-
143
-
144
-
145
-
146
-
147
-
148
-
149
-
150
-
151
-
152
-
153
-
154
-
155
-
156
-
157
-
158
-
159
-
160
-
161
-
162
-
163
-
164
-
165
-
166
-
167
-
168
-
169
-
170
-
171
-
172
-
173
-
174
-
175
-
176
-
177
-
178
-
179
-
180
 |
 |

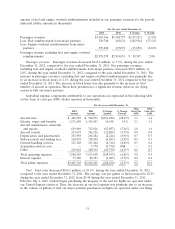
method of accounting. The increase in other expense was due primarily to our recognition of our
portion of the losses incurred by Trip and Air Mekong.
Purchase Accounting Gain (Adjustment). In connection with our preparation of the 2010 tax
return, our management identified an adjustment to the ExpressJet acquisition accounting that resulted
in an increase to the acquired deferred tax liabilities of $5.7 million. The adjustment is reflected on our
consolidated statement of operations for the year ended December 31, 2011 under the caption
‘‘Purchase accounting gain (adjustment).’’
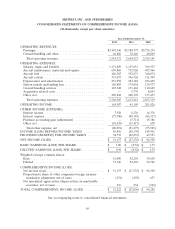
Net Income (loss). Primarily due to factors described above, we incurred a net loss of
$27.3 million, or $0.52 per diluted share, for the year ended December 31, 2011, compared to net
income of $96.4 million, or $1.70 per diluted share, for the year ended December 31, 2010.
Liquidity and Capital Resources
Sources and Uses of Cash
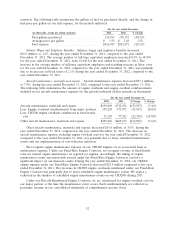
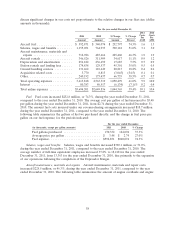
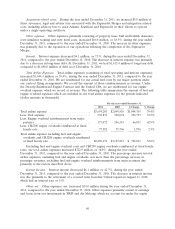
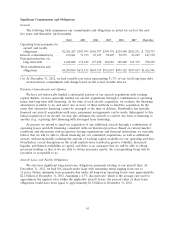
Cash Position and Liquidity. The following table provides a summary of the net cash provided by
(used in) our operating, investing and financing activities for the years ended December 31, 2012 and
2011, and our total cash and marketable securities position as of December 31, 2012 and December 31,
2011 (in thousands).
For the year ended December 31,
2012 2011 $ Change % Change
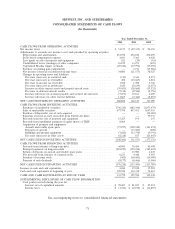
Net cash provided by operating activities ............ $288,824 $ 162,126 $126,698 78.1%
Net cash used in investing activities ................ (108,360) (11,553) (96,807) 837.9%
Net cash used in financing activities ................ (176,218) (133,385) (42,833) 32.1%
December 31, December 31,
2012 2011 $ Change % Change
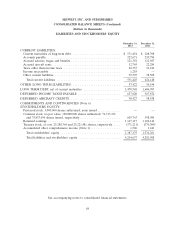
Cash and cash equivalents ...................... $133,772 $129,526 $ 4,246 3.3%
Restricted cash .............................. 19,553 19,434 119 0.6%
Marketable securities ......................... 556,117 497,552 58,565 11.8%
Total ..................................... $709,442 $646,512 $62,930 9.7%
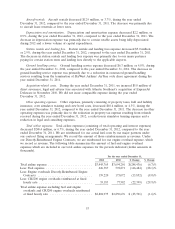
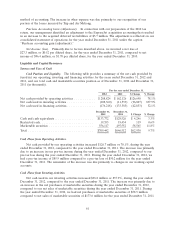
Cash Flows from Operating Activities.
Net cash provided by our operating activities increased $126.7 million or 78.1%, during the year
ended December 31, 2012, compared to the year ended December 31, 2011. The increase was primarily
due to an increase in our pre-tax income during the year ended December 31, 2012, compared to our
pre-tax loss during the year ended December 31, 2011. During the year ended December 31, 2012, we
had a pre-tax income of $85.9 million compared to a pre-tax loss of $50.2 million for the year ended
December 31, 2011. The remainder of the increase was due primarily to changes in our working capital
accounts.
Cash Flows from Investing Activities.
Net cash used in our investing activities increased $96.8 million or 837.9%, during the year ended
December 31, 2012, compared to the year ended December 31, 2011. The increase was primarily due to
an increase in the net purchases of marketable securities during the year ended December 31, 2012,
compared to our net sales of marketable securities during the year ended December 31, 2011. During
the year ended December 31, 2012, we had net purchases of marketable securities of $58.5 million
compared to net sales of marketable securities of $173.6 million for the year ended December 31, 2011.
61