SkyWest Airlines 2012 Annual Report Download - page 96
Download and view the complete annual report
Please find page 96 of the 2012 SkyWest Airlines annual report below. You can navigate through the pages in the report by either clicking on the pages listed below, or by using the keyword search tool below to find specific information within the annual report.-
 1
1 -
2
-
3
-
4
-
5
-
6
-
7
-
8
-
9
-
10
-
11
-
12
-
13
-
14
-
15
-
16
-
17
-
18
-
19
-
20
-
21
-
22
-
23
-
24
-
25
-
26
-
27
-
28
-
29
-
30
-
31
-
32
-
33
-
34
-
35
-
36
-
37
-
38
-
39
-
40
-
41
-
42
-
43
-
44
-
45
-
46
-
47
-
48
-
49
-
50
-
51
-
52
-
53
-
54
-
55
-
56
-
57
-
58
-
59
-
60
-
61
-
62
-
63
-
64
-
65
-
66
-
67
-
68
-
69
-
70
-
71
-
72
-
73
-
74
-
75
-
76
-
77
-
78
-
79
-
80
-
81
-
82
-
83
-
84
-
85
-
 86
86 -
 87
87 -
 88
88 -
 89
89 -
 90
90 -
 91
91 -
 92
92 -
 93
93 -
 94
94 -
 95
95 -
 96
96 -
 97
97 -
 98
98 -
 99
99 -
 100
100 -
 101
101 -
 102
102 -
 103
103 -
 104
104 -
 105
105 -
 106
106 -
107
-
108
-
109
-
110
-
111
-
112
-
113
-
114
-
115
-
116
-
117
-
118
-
119
-
120
-
121
-
122
-
123
-
124
-
125
-
126
-
127
-
128
-
129
-
130
-
131
-
132
-
133
-
134
-
135
-
136
-
137
-
138
-
139
-
140
-
141
-
142
-
143
-
144
-
145
-
146
-
147
-
148
-
149
-
150
-
151
-
152
-
153
-
154
-
155
-
156
-
157
-
158
-
159
-
160
-
161
-
162
-
163
-
164
-
165
-
166
-
167
-
168
-
169
-
170
-
171
-
172
-
173
-
174
-
175
-
176
-
177
-
178
-
179
-
180
 |
 |

SKYWEST, INC. AND SUBSIDIARIES
NOTES TO CONSOLIDATED FINANCIAL STATEMENTS (Continued)
DECEMBER 31, 2012
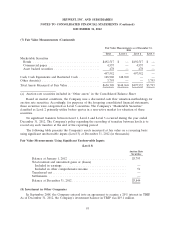
(7) Fair Value Measurements
The Company holds certain assets that are required to be measured at fair value in accordance
with United States GAAP. The Company determined fair value of these assets based on the following
three levels of inputs:
Level 1 — Quoted prices in active markets for identical assets or liabilities.
Level 2 — Observable inputs other than Level 1 prices such as quoted prices for
similar assets or liabilities; quoted prices in markets that are not
active; or other inputs that are observable or can be corroborated by
observable market data for substantially the full term of the assets or
liabilities. Some of the Company’s marketable securities primarily
utilize broker quotes in a non-active market for valuation of these
securities.
Level 3 — Unobservable inputs that are supported by little or no market activity
and that are significant to the fair value of the assets or liabilities,
therefore requiring an entity to develop its own assumptions.
As of December 31, 2012, the Company held certain assets that are required to be measured at
fair value on a recurring basis. Assets measured at fair value on a recurring basis are summarized
below (in thousands):
Fair Value Measurements as of December 31,
2012
Total Level 1 Level 2 Level 3
Marketable Securities
Bonds ...................................... $552,289 $ — $552,289 $ —
Commercial paper ............................. 3,514 — 3,514 —
Asset backed securities .......................... 314 — 314 —
556,117 — 556,117 —
Cash, Cash Equivalents and Restricted Cash ............ 153,325 153,325 — —
Other Assets(a) ................................. 3,844 — — 3,844
Total Assets Measured at Fair Value .................. $713,286 $153,325 $556,117 $3,844
92