SkyWest Airlines 2012 Annual Report Download - page 53
Download and view the complete annual report
Please find page 53 of the 2012 SkyWest Airlines annual report below. You can navigate through the pages in the report by either clicking on the pages listed below, or by using the keyword search tool below to find specific information within the annual report.-
 1
1 -
2
-
3
-
4
-
5
-
6
-
7
-
8
-
9
-
10
-
11
-
12
-
13
-
14
-
15
-
16
-
17
-
18
-
19
-
20
-
21
-
22
-
23
-
24
-
25
-
26
-
27
-
28
-
29
-
30
-
31
-
32
-
33
-
34
-
35
-
36
-
37
-
38
-
39
-
40
-
41
-
42
-
 43
43 -
 44
44 -
 45
45 -
 46
46 -
 47
47 -
 48
48 -
 49
49 -
 50
50 -
 51
51 -
 52
52 -
 53
53 -
 54
54 -
 55
55 -
 56
56 -
 57
57 -
 58
58 -
 59
59 -
 60
60 -
 61
61 -
 62
62 -
 63
63 -
64
-
65
-
66
-
67
-
68
-
69
-
70
-
71
-
72
-
73
-
74
-
75
-
76
-
77
-
78
-
79
-
80
-
81
-
82
-
83
-
84
-
85
-
86
-
87
-
88
-
89
-
90
-
91
-
92
-
93
-
94
-
95
-
96
-
97
-
98
-
99
-
100
-
101
-
102
-
103
-
104
-
105
-
106
-
107
-
108
-
109
-
110
-
111
-
112
-
113
-
114
-
115
-
116
-
117
-
118
-
119
-
120
-
121
-
122
-
123
-
124
-
125
-
126
-
127
-
128
-
129
-
130
-
131
-
132
-
133
-
134
-
135
-
136
-
137
-
138
-
139
-
140
-
141
-
142
-
143
-
144
-
145
-
146
-
147
-
148
-
149
-
150
-
151
-
152
-
153
-
154
-
155
-
156
-
157
-
158
-
159
-
160
-
161
-
162
-
163
-
164
-
165
-
166
-
167
-
168
-
169
-
170
-
171
-
172
-
173
-
174
-
175
-
176
-
177
-
178
-
179
-
180
 |
 |

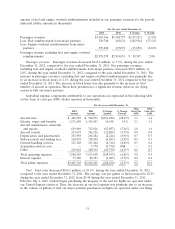
We have valued non-auction rate marketable securities using quoted prices in active markets for
identical assets or liabilities. If a quoted price is not available, we utilize broker quotes in a non-active
market for valuation of these securities. For auction-rate security instruments, quoted prices in active
markets are no longer available. As a result, we have estimated the fair values of these securities
utilizing a discounted cash flow model.
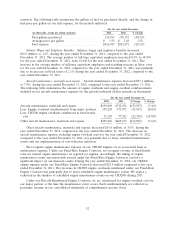
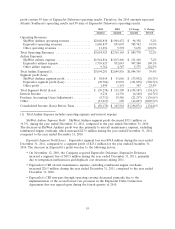
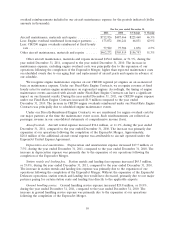
Results of Operations
Our Business Segments
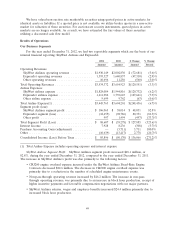
For the year ended December 31, 2012, we had two reportable segments which are the basis of our
internal financial reporting: SkyWest Airlines and ExpressJet.
2012 2011 $ Change % Change
Amount Amount Amount Percent
Operating Revenues:
SkyWest Airlines operating revenue ............ $1,930,149 $2,002,830 $ (72,681) (3.6)%
ExpressJet operating revenues ................ 1,593,527 1,640,837 (47,310) (2.9)%
Other operating revenues .................... 10,696 11,256 (560) (5.0)%
Total Operating Revenues ..................... $3,534,372 $3,654,923 $(120,551) (3.3)%
Airline Expenses:
SkyWest airlines expense .................... $1,824,084 $1,944,816 $(120,732) (6.2)%
ExpressJet airlines expense ................... 1,611,982 1,739,623 (127,641) (7.3)%
Other airline expense ....................... 9,699 9,762 (63) (0.6)%
Total Airline Expense(1) ...................... $3,445,765 $3,694,201 $(248,436) (6.7)%
Segment profit (loss):
SkyWest Airlines segment profit ............... $ 106,065 $ 58,014 $ 48,051 82.8%
ExpressJet segment (loss) .................... (18,455) (98,786) 80,331 (81.3)%
Other profit ............................. 997 1,494 (497) (33.3)%
Total Segment Profit (Loss) .................... $ 88,607 $ (39,278) $ 127,885 (325.6)%
Interest Income ............................ 7,928 8,236 (308) (3.7)%
Purchase Accounting Gain (adjustment) ........... — (5,711) 5,711 100.0%
Other .................................... (10,639) (13,417) 2,778 (20.7)%
Consolidated Income (Loss) Before Taxes .......... $ 85,896 $ (50,170) $ 136,066 (271.2)%
(1) Total Airline Expense includes operating expense and interest expense
SkyWest Airlines Segment Profit. SkyWest Airlines segment profit increased $48.1 million, or
82.8%, during the year ended December 31, 2012, compared to the year ended December 31, 2011.
The increase in SkyWest Airline’s profit was due primarily to the following factors:
• CRJ200 engine overhaul expense incurred under the SkyWest Airlines Fixed-Rate Engine
Contracts decreased $22.6 million. The decrease in CRJ200 engine overhaul expense was
primarily due to a reduction in the number of scheduled engine maintenance events.
• Non-pass-through operating revenue increased by $46.2 million. The increase in non-pass
through operating revenue, was primarily due to an increase in block hour production, receipt of
higher incentive payments and favorable compensation negotiations with our major partners.
• SkyWest Airlines salaries, wages and employee benefits increased $24.4 million primarily due to
increased block hour production.
49