SkyWest Airlines 2012 Annual Report Download - page 62
Download and view the complete annual report
Please find page 62 of the 2012 SkyWest Airlines annual report below. You can navigate through the pages in the report by either clicking on the pages listed below, or by using the keyword search tool below to find specific information within the annual report.-
 1
1 -
2
-
3
-
4
-
5
-
6
-
7
-
8
-
9
-
10
-
11
-
12
-
13
-
14
-
15
-
16
-
17
-
18
-
19
-
20
-
21
-
22
-
23
-
24
-
25
-
26
-
27
-
28
-
29
-
30
-
31
-
32
-
33
-
34
-
35
-
36
-
37
-
38
-
39
-
40
-
41
-
42
-
43
-
44
-
45
-
46
-
47
-
48
-
49
-
50
-
51
-
 52
52 -
 53
53 -
 54
54 -
 55
55 -
 56
56 -
 57
57 -
 58
58 -
 59
59 -
 60
60 -
 61
61 -
 62
62 -
 63
63 -
 64
64 -
 65
65 -
 66
66 -
 67
67 -
 68
68 -
 69
69 -
 70
70 -
 71
71 -
 72
72 -
73
-
74
-
75
-
76
-
77
-
78
-
79
-
80
-
81
-
82
-
83
-
84
-
85
-
86
-
87
-
88
-
89
-
90
-
91
-
92
-
93
-
94
-
95
-
96
-
97
-
98
-
99
-
100
-
101
-
102
-
103
-
104
-
105
-
106
-
107
-
108
-
109
-
110
-
111
-
112
-
113
-
114
-
115
-
116
-
117
-
118
-
119
-
120
-
121
-
122
-
123
-
124
-
125
-
126
-
127
-
128
-
129
-
130
-
131
-
132
-
133
-
134
-
135
-
136
-
137
-
138
-
139
-
140
-
141
-
142
-
143
-
144
-
145
-
146
-
147
-
148
-
149
-
150
-
151
-
152
-
153
-
154
-
155
-
156
-
157
-
158
-
159
-
160
-
161
-
162
-
163
-
164
-
165
-
166
-
167
-
168
-
169
-
170
-
171
-
172
-
173
-
174
-
175
-
176
-
177
-
178
-
179
-
180
 |
 |

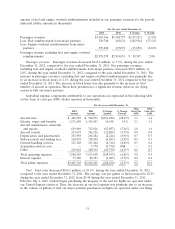
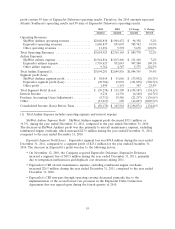
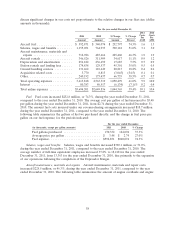
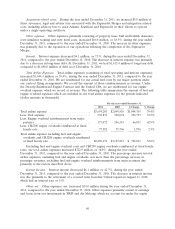
discuss significant changes in our costs not proportionate to the relative changes in our fleet size (dollar
amounts in thousands).
For the year ended December 31,
2011 2010
Cents Cents
2011 2010 $ Change % Change Per Per
Amount Amount Amount Percent ASM ASM
Aircraft fuel .................... $ 592,871 $ 340,074 $ 252,797 74.3% 1.6 1.3
Salaries, wages and benefits ......... 1,155,051 764,933 390,118 51.0% 3.1 3.0
Aircraft maintenance, materials and
repairs ...................... 712,926 487,466 225,460 46.3% 1.9 1.9
Aircraft rentals .................. 346,526 311,909 34,617 11.1% 0.9 1.2
Depreciation and amortization ...... 254,182 236,499 17,683 7.5% 0.7 0.9
Station rentals and landing fees ...... 174,838 129,537 45,301 35.0% 0.5 0.5
Ground handling services .......... 131,462 110,649 20,813 18.8% 0.4 0.4
Acquisition related costs ........... 5,770 8,815 (3,045) (34.5) 0.1 0.1
Other ......................... 240,192 173,437 66,755 38.5% 0.7 0.7
Total operating expenses ........... 3,613,818 2,563,319 1,050,499 41.0% 9.9 10.0
Interest ....................... 80,383 86,517 (6,134) (7.1)% 0.2 0.4
Total airline expenses ............. $3,694,201 $2,649,836 1,044,365 39.4% 10.1 10.4
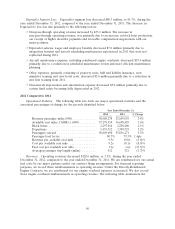
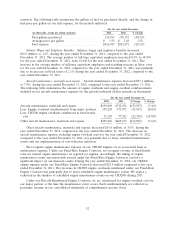
Fuel. Fuel costs increased $252.8 million, or 74.3%, during the year ended December 31, 2011,
compared to the year ended December 31, 2010. The average cost per gallon of fuel increased to $3.48
per gallon during the year ended December 31, 2011, from $2.74 during the year ended December 31,
2010. The amount fuel costs incurred under our revenue-sharing arrangements increased $18.7 million
during the year ended December 31, 2011, compared to the year ended December 31, 2010. The
following table summarizes the gallons of fuel we purchased directly, and the change in fuel price per
gallon on our fuel expense, for the periods indicated:
For the year ended December,
(in thousands, except per gallon amounts) 2011 2010 % Change
Fuel gallons purchased ..................... 170,332 124,094 37.3%
Average price per gallon .................... $ 3.48 $ 2.74 27.0%
Fuel expense ............................. $592,871 $340,074 74.3%
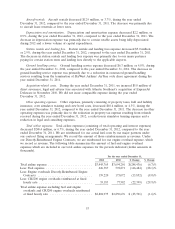
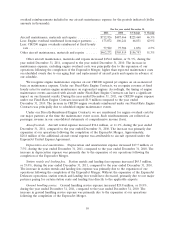
Salaries, wages and benefits. Salaries, wages and benefits increased $390.1 million, or 51.0%,
during the year ended December 31, 2011, compared to the year ended December 31, 2010. The
average number of full-time equivalent employees increased 37.8% to 18,418 for the year ended
December 31, 2011, from 13,363 for the year ended December 31, 2010, due primarily to the expansion
of our operations following the completion of the ExpressJet Merger.
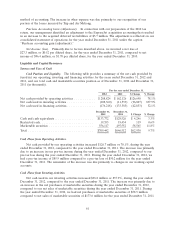
Aircraft maintenance, materials and repairs. Aircraft maintenance, materials and repair costs
increased $225.5 million, or 46.3%, during the year ended December 31, 2011, compared to the year
ended December 31, 2010. The following table summarizes the amount of engine overhauls and engine
58