SkyWest Airlines 2012 Annual Report Download - page 55
Download and view the complete annual report
Please find page 55 of the 2012 SkyWest Airlines annual report below. You can navigate through the pages in the report by either clicking on the pages listed below, or by using the keyword search tool below to find specific information within the annual report.-
 1
1 -
2
-
3
-
4
-
5
-
6
-
7
-
8
-
9
-
10
-
11
-
12
-
13
-
14
-
15
-
16
-
17
-
18
-
19
-
20
-
21
-
22
-
23
-
24
-
25
-
26
-
27
-
28
-
29
-
30
-
31
-
32
-
33
-
34
-
35
-
36
-
37
-
38
-
39
-
40
-
41
-
42
-
43
-
44
-
 45
45 -
 46
46 -
 47
47 -
 48
48 -
 49
49 -
 50
50 -
 51
51 -
 52
52 -
 53
53 -
 54
54 -
 55
55 -
 56
56 -
 57
57 -
 58
58 -
 59
59 -
 60
60 -
 61
61 -
 62
62 -
 63
63 -
 64
64 -
 65
65 -
66
-
67
-
68
-
69
-
70
-
71
-
72
-
73
-
74
-
75
-
76
-
77
-
78
-
79
-
80
-
81
-
82
-
83
-
84
-
85
-
86
-
87
-
88
-
89
-
90
-
91
-
92
-
93
-
94
-
95
-
96
-
97
-
98
-
99
-
100
-
101
-
102
-
103
-
104
-
105
-
106
-
107
-
108
-
109
-
110
-
111
-
112
-
113
-
114
-
115
-
116
-
117
-
118
-
119
-
120
-
121
-
122
-
123
-
124
-
125
-
126
-
127
-
128
-
129
-
130
-
131
-
132
-
133
-
134
-
135
-
136
-
137
-
138
-
139
-
140
-
141
-
142
-
143
-
144
-
145
-
146
-
147
-
148
-
149
-
150
-
151
-
152
-
153
-
154
-
155
-
156
-
157
-
158
-
159
-
160
-
161
-
162
-
163
-
164
-
165
-
166
-
167
-
168
-
169
-
170
-
171
-
172
-
173
-
174
-
175
-
176
-
177
-
178
-
179
-
180
 |
 |

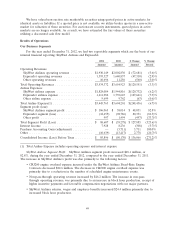
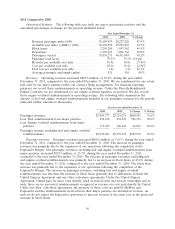
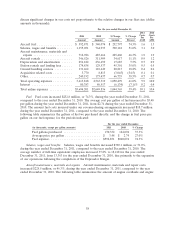
amount of fuel and engine overhaul reimbursements included in our passenger revenues for the periods
indicated (dollar amounts in thousands).
For the year ended December 31,
2012 2011 $ Change % Change
Passenger revenues .......................... $3,467,546 $3,584,777 $(117,231) (3.3)%
Less: Fuel reimbursement from major partners ...... 329,748 492,674 (162,926) (33.1)%
Less: Engine overhaul reimbursement from major
partners ................................ 159,220 173,072 (13,852) (8.0)%
Passenger revenue excluding fuel and engine overhaul
reimbursements ........................... $2,978,578 $2,919,031 $ 59,547 2.0%
Passenger revenues. Passenger revenues decreased $117.2 million, or 3.3%, during the year ended
December 31, 2012, compared to the year ended December 31, 2011. Our passenger revenues,
excluding fuel and engine overhaul reimbursements from major partners, increased $59.5 million, or
2.0%, during the year ended December 31, 2012, compared to the year ended December 31, 2011. The
increase in passenger revenues, excluding fuel and engine overhaul reimbursements, was primarily due
to an increase in block hours of 2.1% during the year ended December 31, 2012 compared to the year
ended December 31, 2011. The increase in block hours was due primarily to the increase in total
number of aircraft in operation, Block hour production is a significant revenue driver in our flying
contracts with our major partners.
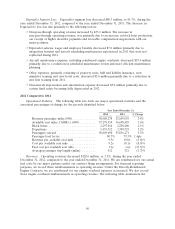
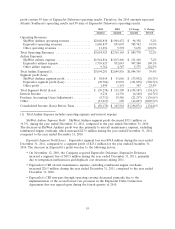
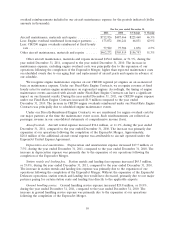
Individual expense components attributable to our operations are expressed in the following table
on the basis of cents per ASM. (dollar amounts in thousands).
For the year ended December 31,
2012 2011
2012 2011 $ Change % Change Cents Per Cents Per
Amount Amount Amount Percent ASM ASM
Aircraft fuel ................ $ 426,387 $ 592,871 $(166,484) (28.1)% 1.1 1.6
Salaries, wages and benefits .... 1,171,689 1,155,051 16,638 1.4% 3.1 3.1
Aircraft maintenance, materials
and repairs ............... 659,869 712,926 (53,057) (7.4)% 1.8 1.9
Aircraft rentals .............. 333,637 346,526 (12,889) (3.7)% 0.9 0.9
Depreciation and amortization . . 251,958 254,182 (2,224) (0.9)% 0.7 0.7
Station rentals and landing fees . . 169,855 174,838 (4,983) (2.9)% 0.5 0.5
Ground handling services ...... 125,148 131,462 (6,314) (4.8)% 0.3 0.4
Acquisition-related costs ....... — 5,770 (5,770) NM — 0.1
Other .................... 229,842 240,192 (10,350) (4.3)% 0.6 0.7
Total operating expenses ....... 3,368,385 3,613,818 (245,433) (6.8)% 9.0 9.9
Interest expense ............. 77,380 80,383 (3,003) (3.7)% 0.2 0.2
Total airline expenses ......... $3,445,765 $3,694,201 (248,436) (6.7)% 9.2 10.1
Fuel. Fuel costs decreased $166.5 million, or 28.1%, during the year ended December 31, 2012,
compared to the year ended December 31, 2011. The average cost per gallon of fuel increased to $3.59
during the year ended December 31, 2012, from $3.48 during the year ended December 31, 2011.
Effective July 1, 2012, United began purchasing the majority of the fuel for flights we operated under
our United Express contracts. Thus, the decrease in our fuel expense was primarily due to an increase
in the volume of gallons of fuel our major partners purchased on flights we operated under our flying
51