SkyWest Airlines 2003 Annual Report Download - page 36
Download and view the complete annual report
Please find page 36 of the 2003 SkyWest Airlines annual report below. You can navigate through the pages in the report by either clicking on the pages listed below, or by using the keyword search tool below to find specific information within the annual report.-
 1
1 -
2
-
3
-
4
-
5
-
6
-
7
-
8
-
9
-
10
-
11
-
12
-
13
-
14
-
15
-
16
-
17
-
18
-
19
-
20
-
21
-
22
-
23
-
24
-
25
-
 26
26 -
 27
27 -
 28
28 -
 29
29 -
 30
30 -
 31
31 -
 32
32 -
 33
33 -
 34
34 -
 35
35 -
 36
36 -
 37
37 -
 38
38 -
 39
39 -
 40
40 -
 41
41 -
 42
42 -
 43
43 -
 44
44 -
 45
45 -
 46
46 -
47
-
48
-
49
-
50
-
51
-
52
-
53
-
54
-
55
-
56
-
57
-
58
-
59
-
60
-
61
-
62
-
63
 |
 |

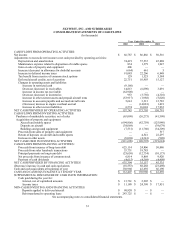
SKYWEST, INC. AND SUBSIDIARIES
CONSOLIDATED STATEMENTS OF CASH FLOWS
(In thousands)
Year Ended December 31,
2003 2002 2001
CASH FLOWS FROM OPERATING ACTIVITIES:
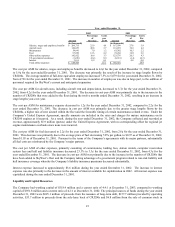
Net income $ 66,787 $ 86,866 $ 50,516
Adjustments to reconcile net income to net cash provided by operating activities:
Depreciation and amortization 74,419 57,535 45,888
Maintenance expense related to disposition of rotable spares 834 1,379 1,947
Gain on sale of property and equipment 406 — —
Increase (decrease) in allowance for doubtful accounts (664) 661 5
Increase in deferred income taxes 91,085 22,206 6,948
Tax benefit from exercise of common stock options 129 1,525 5,584
Deferred aircraft credits, net of accretion 22,751 10,903 15,127
Changes in operating assets and liabilities:
Increase in restricted cash (9,160) — —
Decrease (increase) in receivables 14,813 (6,890) 3,091
Increase in income tax receivable (62,908) — —
Decrease (increase) in inventories 953 (3,750) (4,301)
Increase in other current assets and prepaid aircraft rents (53,917) (1,988) (5,820)
Increase in accounts payable and accrued aircraft rents 5,641 3,313 12,783
(Decrease) increase in engine overhaul accrual — (14,081) 1,091
Increase in other current liabilities 6,574 16,024 17,932
NET CASH PROVIDED BY OPERATING ACTIVITIES 157,743 173,703 150,791
CASH FLOWS FROM INVESTING ACTIVITIES:
Purchases of marketable securities, net of sales (63,090) (26,273) (41,590)
Acquisition of property and equipment:
Aircraft and rotable spares (694,906) (82,759) (125,940)
Deposits on aircraft (38,069) — (39,679)
Buildings and ground equipment (7,531) (11,760) (34,309)
Proceeds from sales of property and equipment — — 517
Return of deposits on aircraft and rotable spares — 4,541 22,297
Increase in other assets (8,094) (4,341) (920)
NET CASH USED IN INVESTING ACTIVITIES (811,690) (120,592) (219,624)
CASH FLOWS FROM FINANCING ACTIVITIES:
Proceeds from issuance of long-term debt 625,114 24,806 50,086
Proceeds from sales leaseback transactions 33,731 18,785 —
Principal payments on long-term debt (25,650) (12,734) (10,173)
Net proceeds from issuance of common stock 6,814 8,869 9,920
Payment of cash dividends (4,615) (4,569) (4,498)
NET CASH PROVIDED BY FINANCING ACTIVITIES 635,394 35,157 45,335
(Decrease) increase in cash and cash equivalents (18,553) 88,268 (23,498)
Cash and cash equivalents at beginning of year 130,960 42,692 66,190
CASH AND CASH EQUIVALENTS AT END OF YEAR $ 112,407 $ 130,960 $ 42,692
SUPPLEMENTAL DISCLOSURE OF CASH FLOW INFORMATION:
Cash paid during the year for:
Interest, net of capitalized amounts $ 13,761 $ 2,205 $ —
Income taxes $ 11,188 $ 24,390 $ 17,951
NON-CASH INVESTING AND FINANCING ACTIVITIES
Deposits applied to delivered aircraft $ 90,920 $ — $ —
Debt transferred to operating lease $ 243,725 $ — $ —
See accompanying notes to consolidated financial statements.
33