SkyWest Airlines 2003 Annual Report Download - page 18
Download and view the complete annual report
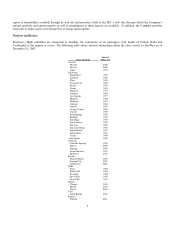
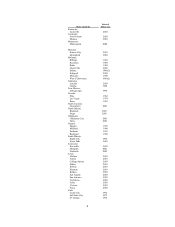
Please find page 18 of the 2003 SkyWest Airlines annual report below. You can navigate through the pages in the report by either clicking on the pages listed below, or by using the keyword search tool below to find specific information within the annual report.-
 1
1 -
2
-
3
-
4
-
5
-
6
-
7
-
 8
8 -
 9
9 -
 10
10 -
 11
11 -
 12
12 -
 13
13 -
 14
14 -
 15
15 -
 16
16 -
 17
17 -
 18
18 -
 19
19 -
 20
20 -
 21
21 -
 22
22 -
 23
23 -
 24
24 -
 25
25 -
 26
26 -
 27
27 -
 28
28 -
29
-
30
-
31
-
32
-
33
-
34
-
35
-
36
-
37
-
38
-
39
-
40
-
41
-
42
-
43
-
44
-
45
-
46
-
47
-
48
-
49
-
50
-
51
-
52
-
53
-
54
-
55
-
56
-
57
-
58
-
59
-
60
-
61
-
62
-
63
 |
 |

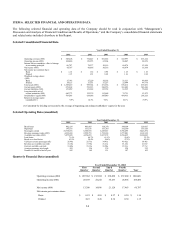
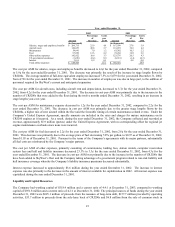
Year Ended December 31, 2002
First
Quarter
Second
Quarter
Third
Quarter
Fourth
Quarter
Year
Operating revenues (000) $ 174,346 $ 189,233 $ 202,713 $ 208,155 $ 774,447
Operating income (000) 22,456 32,722 34,572 29,805 119,555
Income before cumulative effect of change
in accounting principle 15,656 21,912 22,923 17,786 78,277
Cumulative effect of change in accounting
principle, net of taxes of $5,492 8,589 - - - 8,589
Net income (000) 24,245 21,912 22,923 17,786 86,866
Basic earnings per share:
Income before cumulative effect of change in
accounting principle $ 0.28 $ 0.38 $ 0.40 $ 0.31 $ 1.37
Cumulative effect of change in accounting
Principle, net of tax 0.15 - - - 0.15
Basic earnings per share $ 0.43 $ 0.38 $ 0.40 $ 0.31 $ 1.52
Diluted earnings per share:
Income before cumulative effect of change in
accounting principle $ 0.27 $ 0.38 $ 0.40 $ 0.31 $ 1.36
Cumulative effect of change in accounting
principle, net of tax 0.15 - - - 0.15
Diluted earnings per share $ 0.42 $ 0.38 $ 0.40 $ 0.31 $ 1.51
Weighted average common shares:
Basic: 56,939 57,117 57,426 57,436 57,229
Diluted: 57,530 57,574 57,584 57,518 57,551
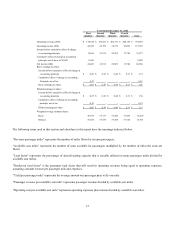
The following terms used in this section and elsewhere in this report have the meanings indicated below:
"Revenue passenger miles" represents the number of miles flown by revenue passengers.
"Available seat miles" represents the number of seats available for passengers multiplied by the number of miles the seats are
flown.
"Load factor" represents the percentage of aircraft seating capacity that is actually utilized (revenue passenger miles divided by
available seat miles).
"Breakeven load factor" is the passenger load factor that will result in operating revenues being equal to operating expenses,
assuming constant revenue per passenger mile and expenses.
"Yield per passenger mile" represents the average amount one passenger pays to fly one mile.
"Passenger revenue per available seat mile" represents passenger revenue divided by available seat miles.
"Operating cost per available seat mile" represents operating expenses plus interest divided by available seat miles.
15