SkyWest Airlines 2003 Annual Report Download - page 17
Download and view the complete annual report
Please find page 17 of the 2003 SkyWest Airlines annual report below. You can navigate through the pages in the report by either clicking on the pages listed below, or by using the keyword search tool below to find specific information within the annual report.-
 1
1 -
2
-
3
-
4
-
5
-
6
-
 7
7 -
 8
8 -
 9
9 -
 10
10 -
 11
11 -
 12
12 -
 13
13 -
 14
14 -
 15
15 -
 16
16 -
 17
17 -
 18
18 -
 19
19 -
 20
20 -
 21
21 -
 22
22 -
 23
23 -
 24
24 -
 25
25 -
 26
26 -
 27
27 -
28
-
29
-
30
-
31
-
32
-
33
-
34
-
35
-
36
-
37
-
38
-
39
-
40
-
41
-
42
-
43
-
44
-
45
-
46
-
47
-
48
-
49
-
50
-
51
-
52
-
53
-
54
-
55
-
56
-
57
-
58
-
59
-
60
-
61
-
62
-
63
 |
 |

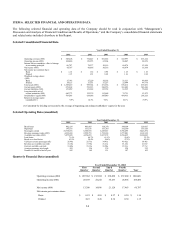
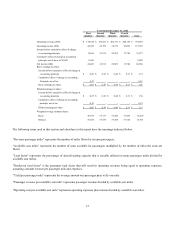
ITEM 6. SELECTED FINANCIAL AND OPERATING DATA
The following selected financial and operating data of the Company should be read in conjunction with “Management’s
Discussion and Analysis of Financial Condition and Results of Operations,” and the Company’s consolidated financial statements
and related notes included elsewhere in this Report.
Selected Consolidated Financial Data
Year Ended December 31,
2003 2002 2001 2000 1999
Operating revenues (000) $ 888,026 $ 774,447 $ 601,865 $ 522,997 $ 455,122
Operating income (000) 108,480 119,555 65,564 89,047 82,819
Income before cumulative effect of change
in accounting principle 66,787 78,277 50,516 60,874 53,858
Net income (000) 66,787 86,866 50,516 60,874 53,858
Net income per common share:
Basic $ 1.16 $ 1.52 $ 0.90 $ 1.18 $ 1.10
Diluted 1.15 1.51 0.88 1.16 1.08
Weighted average shares
(000):
Basic 57,745 57,229 56,365 51,521 48,964
Diluted 58,127 57,551 57,237 52,644 49,778
Total assets (000) $ 1,529,210 $ 999,384 $ 831,566 $ 676,412 $ 459,481
Current assets (000) 670,368 513,233 386,556 361,602 240,160
Current liabilities (000) 151,959 121,388 115,738 81,935 79,684
Long-term debt, net of
current maturities (000) 462,773 125,379 113,688 75,751 53,873
Stockholders’ equity (000) 709,063 638,686 545,840 484,953 298,526
Return on average equity
(unaudited)(1) 9.9% 14.7% 9.8% 16.1% 19.9%
(1) Calculated by dividing net income by the average of beginning and ending stockholders’ equity for the year
Selected Operating Data (unaudited)
Year Ended December 31,
2003 2002 2001 2000 1999
Block hours 482,158 405,007 356,370 344,694 328,067
Departures 395,631 351,631 333,383 332,509 333,620
Passengers carried 10,738,691 8,388,935 6,229,867 5,598,499 5,446,872
Revenue passenger miles (000) 4,222,669 2,990,753 1,732,180 1,277,001 1,161,918
Available seat miles (000) 5,875,029 4,356,053 2,837,278 2,256,635 2,100,062
Load factor 71.9% 68.7% 61.1% 56.6% 55.3%
Break-even load factor 63.9% 58.4% 54.4% 47.2% 45.6%
Yield per revenue passenger mile 20.90¢ 25.73¢ 34.41¢ 40.42¢ 38.46¢
Revenue per available seat mile 15.10¢ 17.78¢ 21.21¢ 23.18¢ 21.67¢
Cost per available seat mile 13.40¢ 15.12¢ 18.90¢ 19.23¢ 17.71¢
Average passenger trip length 393 356 278 228 213
Number of aircraft at end of year 185 149 131 107 102
Quarterly Financial Data (unaudited)
Year Ended December 31, 2003
First
Quarter
Second
Quarter
Third
Quarter
Fourth
Quarter
Year
Operating revenues (000) $ 207,362 $ 212,694 $ 230,490 $ 237,480 $ 888,026
Operating income (000) 20,149 24,252 35,233 28,846 108,480
Net income (000) 13,300 14,896 21,128 17,463 66,787
Net income per common share:
Basic $ 0.23 $ 0.26 $ 0.37 $ 0.30 $ 1.16
Diluted 0.23 0.26 0.36 0.30 1.15
14