Samsung 1998 Annual Report Download - page 5
Download and view the complete annual report
Please find page 5 of the 1998 Samsung annual report below. You can navigate through the pages in the report by either clicking on the pages listed below, or by using the keyword search tool below to find specific information within the annual report.-
 1
1 -
 2
2 -
 3
3 -
 4
4 -
 5
5 -
 6
6 -
 7
7 -
 8
8 -
 9
9 -
 10
10 -
 11
11 -
 12
12 -
 13
13 -
 14
14 -
 15
15 -
 16
16 -
17
-
18
-
19
-
20
-
21
-
22
-
23
-
24
-
25
-
26
-
27
-
28
-
29
-
30
-
31
-
32
-
33
-
34
-
35
-
36
-
37
-
38
-
39
-
40
-
41
-
42
-
43
-
44
-
45
-
46
-
47
-
48
-
49
-
50
-
51
-
52
-
53
-
54
-
55
-
56
-
57
-
58
-
59
-
60
-
61
-
62
-
63
-
64
-
65
-
66
-
67
 |
 |
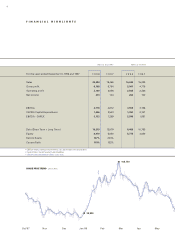
For the years ended December 31, 1998 and 1997
1998 1997 1998 1997
Sales 20,084 18,465 16,640 15,299
Gross profit 6,108 5,764 5,061 4,776
Operating profit 3,100 2,856 2,568 2,366
Net Income 313 124 260 102
EBITDA 4,778 3,812 3,959 3,158
CAPEX (Capital Expenditure) 1,646 2,543 1,363 2,107
EBITDA - CAPEX 3,133 1,269 2,596 1,051
Debt (Short Term + Long Term) 10,219 12,979 8,466 10,753
Equity 6,970 5,830 5,775 4,830
Debt to Equity 147% 223%
Current Ratio 110% 132%
FINANCIAL HIGHLIGHTS
•EBITDA means earnings before interest, tax, depreciation and amortization
•Current Ratio: Current assets/Current liabilities
•US$ amounts calculated at US$1=1,207 won
Billions of Korean Won Millions of US Dollar
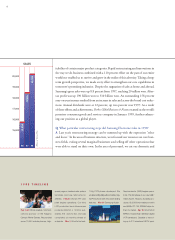
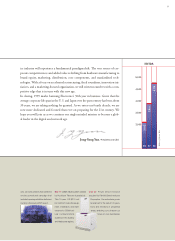
4
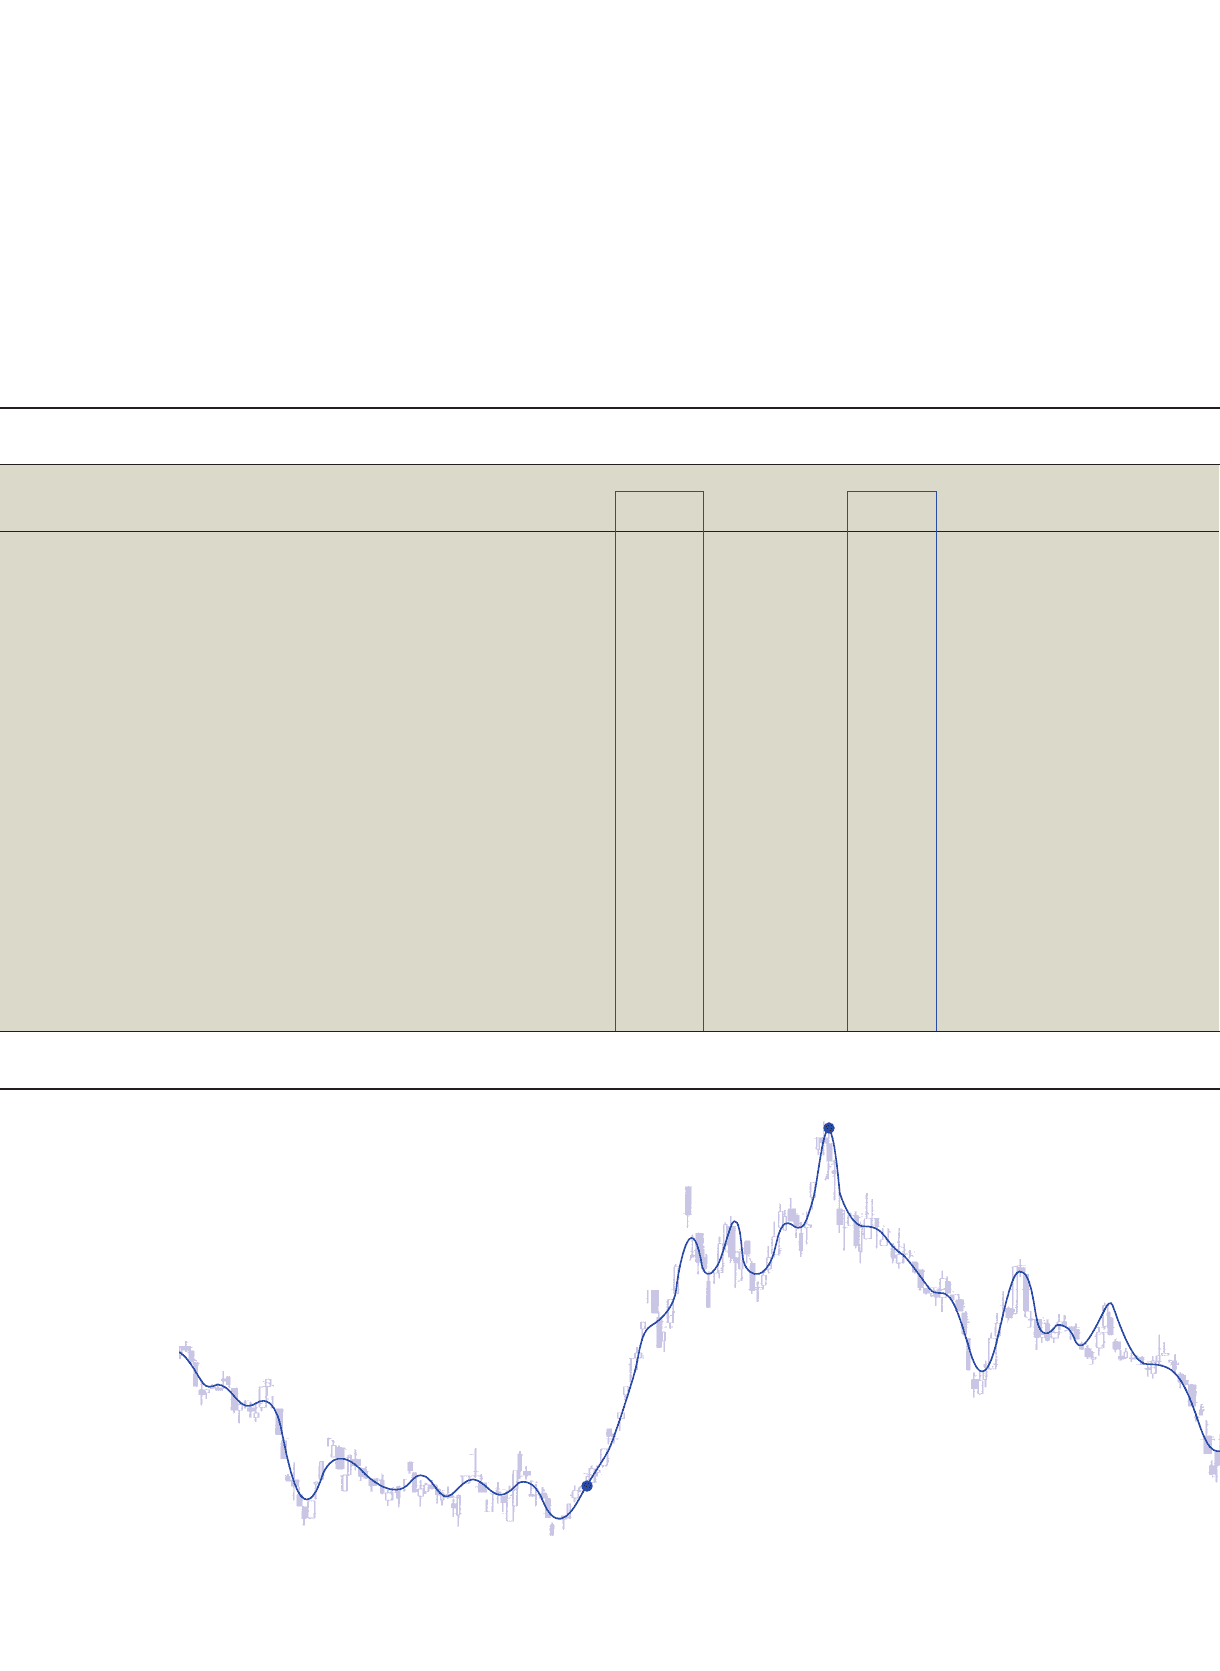
38,890
108,150
Oct ’97 Nov Dec Jan ’98 Feb Mar Apr May
SHARE PRICE TREND (Korean Won)