Samsung 1998 Annual Report Download - page 48
Download and view the complete annual report
Please find page 48 of the 1998 Samsung annual report below. You can navigate through the pages in the report by either clicking on the pages listed below, or by using the keyword search tool below to find specific information within the annual report.-
 1
1 -
2
-
3
-
4
-
5
-
6
-
7
-
8
-
9
-
10
-
11
-
12
-
13
-
14
-
15
-
16
-
17
-
18
-
19
-
20
-
21
-
22
-
23
-
24
-
25
-
26
-
27
-
28
-
29
-
30
-
31
-
32
-
33
-
34
-
35
-
36
-
37
-
 38
38 -
 39
39 -
 40
40 -
 41
41 -
 42
42 -
 43
43 -
 44
44 -
 45
45 -
 46
46 -
 47
47 -
 48
48 -
 49
49 -
 50
50 -
 51
51 -
 52
52 -
 53
53 -
 54
54 -
 55
55 -
 56
56 -
 57
57 -
 58
58 -
59
-
60
-
61
-
62
-
63
-
64
-
65
-
66
-
67
 |
 |

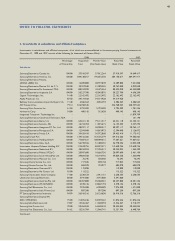
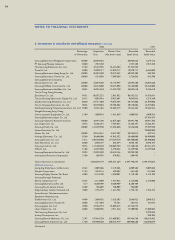
1998 1997
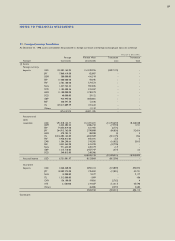
Percentage Acquisition Market Value Recorded Recorded
of Ownership Cost (Net book value) Book Value Book Value
DNS Korea Co., Ltd. 43.70 2,185,000 5,840,296 2,185,000 2,185,000
Samsung-GE Medical SystemsCo., Ltd. 34.00 2,045,261 7,141,020 2,045,261 2,045,261
Seoul Commtech. Co., Ltd. 33.33 4,191,977 6,951,412 4,191,977 4,191,977
Samsung Economic Research Institute 29.80 8,940,000 9,014,964 8,940,000 1,800,000
Samsung Data Systems Co., Ltd. 29.94 17,966,660 27,761,967 17,966,660 17,966,660
Samsung Corning Co., Ltd. 48.36 86,744,180 127,238,729 86,744,180 86,710,798
Samsung Lions Co., Ltd. 27.50 275,000 - 275,000 275,000
Samsung Motors Inc. 21.11 170,000,000 42,765,677 170,000,000 170,000,000
Towa Korea Co., Ltd. 40.00 800,000 3,419,444 800,000 800,000
Posco Huls Co., Ltd. 20.00 17,200,000 14,799,193 17,200,000 17,200,000
Samsung Display Devices Co., Ltd.
(Common stock) 13.29 230,173,725 318,094,455 230,173,725 129,040,723
Samsung Display Devices Co., Ltd.
(Preferred stock) 3.38 2,271,792 1,690,826 2,271,792 2,271,792
Samsung Fine Chemicals Co., Ltd. 8.83 33,040,382 16,681,966 33,040,382 28,307,402
Samsung Aerospace Industries Ltd. 8.13 30,975,037 17,539,620 30,975,037 30,975,037
Hotel Shilla Co., Ltd. 5.32 8,973,516 11,125,137 8,973,516 6,682,901
Samsung Petrochemical Co., Ltd. 9.93 8,040,460 19,085,460 8,040,460 2,530,860
Samsung General Chemical Co., Ltd. 3.66 17,555,670 12,760,190 17,555,670 17,555,670
Affiliated companies, Continued :
Hewlett Packard Korea Ltd. - - - - 7,245,000
Texas Instruments Samsung
Electronics Porluguesa., Ltd. 38.00 6,347,494 6,347,494 6,347,494 -
Other affiliated companies 1,068,465 3,735,300 1,068,465 873,195
Total investments in affiliated companies 1,140,261,068 1,237,960,665 1,138,615,580 815,457,692
4,196,765,247 3,233,311,929 4,086,405,877 2,509,654,756
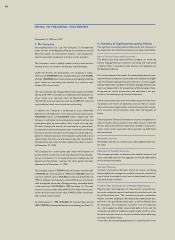
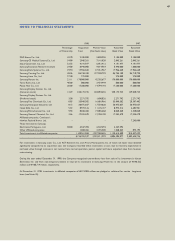
For investments in Samsung Lions Co., Ltd, AST Research Inc. and Arrary Microsystems Inc. of which net book value declined
significantly compared to its acquisition cost, the Company recorded these investments at cost, due to recovery expectation in
net book value through increase in net income from normal operation, paid-in capital and future expected value from business
restructuring.
During the year ended December 31, 1998, the Company recognized extraordinary loss from sale of its investment in Icheon
Electronics Inc. and from non-temporary decline in value of its investment in Samsung Watch Inc. in the amount of ₩190,522
million and ₩108,714 million, respectively.
At December 31, 1998, investments in affiliated companies of ₩174,288 million are pledged as collateral for certain long-term
loans (see Note 10).
NOTES TO FINANCIAL STATEMENTS
47