Samsung 1998 Annual Report Download - page 35
Download and view the complete annual report
Please find page 35 of the 1998 Samsung annual report below. You can navigate through the pages in the report by either clicking on the pages listed below, or by using the keyword search tool below to find specific information within the annual report.-
 1
1 -
2
-
3
-
4
-
5
-
6
-
7
-
8
-
9
-
10
-
11
-
12
-
13
-
14
-
15
-
16
-
17
-
18
-
19
-
20
-
21
-
22
-
23
-
24
-
 25
25 -
 26
26 -
 27
27 -
 28
28 -
 29
29 -
 30
30 -
 31
31 -
 32
32 -
 33
33 -
 34
34 -
 35
35 -
 36
36 -
 37
37 -
 38
38 -
 39
39 -
 40
40 -
 41
41 -
 42
42 -
 43
43 -
 44
44 -
 45
45 -
46
-
47
-
48
-
49
-
50
-
51
-
52
-
53
-
54
-
55
-
56
-
57
-
58
-
59
-
60
-
61
-
62
-
63
-
64
-
65
-
66
-
67
 |
 |
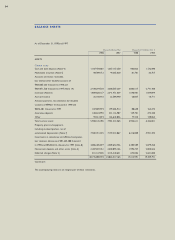
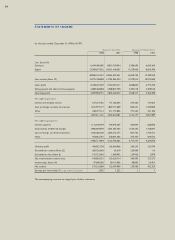
BALANCE SHEETS
As of December 31, 1998 and 1997
Thousands of Korean Won Thousands of US Dollars (Note 3)
1998 1997 1998 1997
ASSETS
Current assets
Cash and bank deposits (Note 4) 1,187,478,681 1,367,157,250 983,826 1,132,690
Marketable securities (Note 5) 98,709,712 44,365,620 81,781 36,757
Accounts and notes receivable,
less allowance for doubtful accounts of
₩20,605,233 thousand in 1998 and
₩29,871,528 thousand in 1997 (Note 19) 2,418,244,510 3,308,507,239 2,003,517 2,741,100
Inventory (Note 6) 1,869,620,127 2,341,451,639 1,548,981 1,939,894
Accrued income 25,150,916 22,584,940 20,837 18,711
Advance payments, less allowance for doubtful
accounts of ₩982,116 thousand in 1998 and
₩356,201 thousand in 1997 107,009,973 199,486,914 88,658 165,275
Guarantee deposits 168,618,992 331,116,907 139,701 274,330
Other 93,312,874 166,643,056 77,310 138,064
Total current assets 5,968,145,785 7,781,313,565 4,944,611 6,446,821
Property, plant and equipment,
including revalued portion, net of
accumulated depreciation (Note 7) 7,502,721,325 7,159,313,067 6,216,008 5,931,494
Investments in subsidiaries and affiliated companies,
less valuation allowance of ₩1,645,488 thousand
in 1998 and ₩5,584,116 thousand in 1997 (Note 8) 4,086,405,877 2,509,654,756 3,385,589 2,079,250
Noncurrent deposits and other assets (Note 4) 2,407,659,761 2,438,895,146 1,994,747 2,020,626
Deferred charges (Note 2) 811,147,845 3,176,340,631 672,036 2,631,600
20,776,080,593 23,065,517,165 17,212,991 19,109,791
Continued ;
The accompanying notes are an integral part of these statements.
34