Samsung 1998 Annual Report Download - page 36
Download and view the complete annual report
Please find page 36 of the 1998 Samsung annual report below. You can navigate through the pages in the report by either clicking on the pages listed below, or by using the keyword search tool below to find specific information within the annual report.-
 1
1 -
2
-
3
-
4
-
5
-
6
-
7
-
8
-
9
-
10
-
11
-
12
-
13
-
14
-
15
-
16
-
17
-
18
-
19
-
20
-
21
-
22
-
23
-
24
-
25
-
 26
26 -
 27
27 -
 28
28 -
 29
29 -
 30
30 -
 31
31 -
 32
32 -
 33
33 -
 34
34 -
 35
35 -
 36
36 -
 37
37 -
 38
38 -
 39
39 -
 40
40 -
 41
41 -
 42
42 -
 43
43 -
 44
44 -
 45
45 -
 46
46 -
47
-
48
-
49
-
50
-
51
-
52
-
53
-
54
-
55
-
56
-
57
-
58
-
59
-
60
-
61
-
62
-
63
-
64
-
65
-
66
-
67
 |
 |

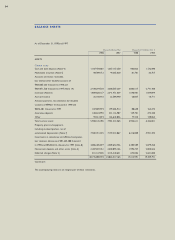
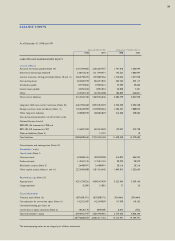
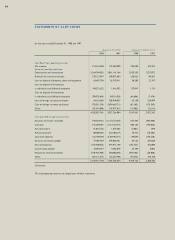
As of December 31, 1998 and 1997
Thousands of Korean Won Thousands of US Dollars (Note 3)
1998 1997 1998 1997
LIABILITIES AND SHAREHOLDERS’ EQUITY
Current liabilities
Accounts and notes payable (Note 19) 2,101,399,002 2,036,207,957 1,741,010 1,686,999
Short-term borrowings (Note 9) 238,413,236 1,311,944,971 197,525 1,086,947
Current maturities of long-termdebt (Notes 10 and 11) 2,064,758,293 1,293,807,566 1,710,653 1,071,920
Accrued expenses 655,682,599 836,591,876 543,233 693,117
Dividends payable 87,759,832 59,969,415 72,709 49,685
Income taxes payable 42,052,010 8,981,053 34,840 7,441
Other 225,502,128 322,053,208 186,829 266,821
Total current liabilities 5,415,567,100 5,869,556,046 4,486,799 4,862,930
Long-term debt, less current maturities (Note 10) 6,461,904,368 8,094,453,539 5,353,690 6,706,258
Foreign currency notes and bonds (Note 11) 1,453,628,909 2,278,904,464 1,204,332 1,888,073
Other long-term liabilities 258,900,949 300,065,839 214,500 248,605
Accrued severance benefits, net of transfer to the
National Pension Fund of
₩39,495,146 thousand in 1998 and
₩72,107,419 thousand in 1997 216,097,320 692,574,539 179,037 573,798
Deferred liabilities (Note 2) - 21,757 - 18
Total liabilities 13,806,098,646 17,235,576,184 11,438,358 14,279,682
Commitments and contingencies (Note 12)
Shareholders’ equity
Capital stock (Note 1)
Common stock 623,868,165 490,350,200 516,875 406,255
Preferred stock 119,467,135 119,467,135 98,979 98,979
Revaluation surplus (Note 7) 24,400,991 24,400,991 20,216 20,216
Other capital surplus (Notes 1 and 11) 2,225,484,888 1,451,541,645 1,843,815 1,202,603
Retained earnings (Note 13)
Appropriated 4,251,578,256 4,030,347,930 3,522,434 3,339,145
Unappropriated 32,306 31,881 27 26
Capital adjustments
Treasury stock (Note 15) (427,838,371) (427,838,371) (354,464) (354,464)
Consideration for conversion rights (Note 11) 142,352,407 142,549,059 117,939 118,102
Unrealized holding gain (loss) on
investments in equity securities (Note 2) 10,636,170 (909,489) 8,812 (753)
Total shareholders’ equity 6,969,981,947 5,829,940,981 5,774,633 4,830,109
20,776,080,593 23,065,517,165 17,212,991 19,109,791
The accompanying notes are an integral part of these statements.
BALANCE SHEETS
35