Samsung 1998 Annual Report Download - page 40
Download and view the complete annual report
Please find page 40 of the 1998 Samsung annual report below. You can navigate through the pages in the report by either clicking on the pages listed below, or by using the keyword search tool below to find specific information within the annual report.-
 1
1 -
2
-
3
-
4
-
5
-
6
-
7
-
8
-
9
-
10
-
11
-
12
-
13
-
14
-
15
-
16
-
17
-
18
-
19
-
20
-
21
-
22
-
23
-
24
-
25
-
26
-
27
-
28
-
29
-
 30
30 -
 31
31 -
 32
32 -
 33
33 -
 34
34 -
 35
35 -
 36
36 -
 37
37 -
 38
38 -
 39
39 -
 40
40 -
 41
41 -
 42
42 -
 43
43 -
 44
44 -
 45
45 -
 46
46 -
 47
47 -
 48
48 -
 49
49 -
 50
50 -
51
-
52
-
53
-
54
-
55
-
56
-
57
-
58
-
59
-
60
-
61
-
62
-
63
-
64
-
65
-
66
-
67
 |
 |
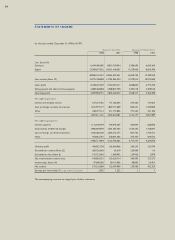
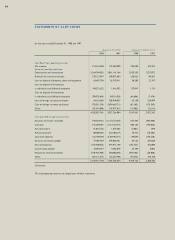
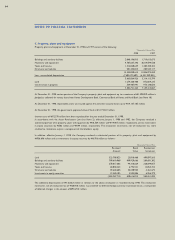
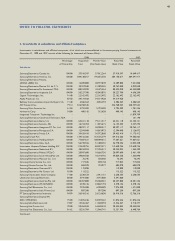
for the years ended December 31, 1998 and 1997
Thousands of Korean Won Thousands of US Dollars (Note 3)
1998 1997 1998 1997
Cash used in investing activities
Proceeds form sale of marketable securities 191,042,944 528,270,377 158,279 437,672
Acquisition of marketable securities (254,507,970) (554,330,468) (210,860) (459,263)
Proceeds from disposal of property, plant and equipment 62,890,485 20,842,796 52,105 17,268
Acquisition of property, plant and equipment (1,645,610,565) (2,542,946,267) (1,363,389) (2,106,832)
Proceeds form sale of investments in
subsidiaries and affiliated companies 106,700,178 37,091,441 88,401 30,730
Acquisition of investments in
subsidiaries and affiliated companies (1,842,969,455) (548,874,765) (1,526,901) (454,743)
Decrease in noncurrent deposits and other assets 1,079,806,546 381,897,457 894,620 316,402
Increase in noncurrent deposits and other assets (900,817,374) (909,332,725) (746,328) (753,382)
Increase in deferred charges (1,162,296,579) (776,765,405) (962,963) (643,550)
Other 117,544,623 (186,973,691) 97,386 (154,908)
(4,248,217,167) (4,551,121,250) (3,519,650) (3,770,606)
Cash provided by (used in) financing activities:
Proceeds from short-term borrowings 1,688,223,932 3,247,391,734 1,398,694 2,690,465
Repayment of short-term borrowings (2,757,026,220) (2,778,036,371) (2,284,197) (2,301,604)
Proceeds from long-term debt 3,007,406,802 1,794,501,364 2,491,638 1,486,745
Repayment of long-term debt (2,733,063,289) (561,803,917) (2,264,344) (465,455)
Proceeds from foreign currency notes and bonds - 559,644,754 - 463,666
Increase in deferred charges (10,263,238) (14,405,595) (8,503) (11,935)
Repayment of current maturities of long-term debt (1,293,807,566) (500,798,426) (1,071,920) (414,911)
Issuance of common stock 894,630,000 235,677,002 741,201 195,259
Payments of dividends (59,969,415) (64,312,238) (49,685) (53,283)
Other (13,544,112) 253,604,574 (11,221) 210,111
(1,277,413,106) 2,171,462,881 (1,058,337) 1,799,058
Net (decrease) increase in cash and bank deposits (179,678,569) 404,125,285 (148,864) 334,818
Cash and bank deposits at beginning of year 1,367,157,250 963,031,965 1,132,690 797,872
Cash and bank deposits at end of year 1,187,478,681 1,367,157,250 983,826 1,132,690
The accompanying notes are an integral part of these statements.
STATEMENTS OF CASH FLOWS
39