Redbox 2003 Annual Report Download - page 29
Download and view the complete annual report
Please find page 29 of the 2003 Redbox annual report below. You can navigate through the pages in the report by either clicking on the pages listed below, or by using the keyword search tool below to find specific information within the annual report.-
 1
1 -
2
-
3
-
4
-
5
-
6
-
7
-
8
-
9
-
10
-
11
-
12
-
13
-
14
-
15
-
16
-
17
-
18
-
 19
19 -
 20
20 -
 21
21 -
 22
22 -
 23
23 -
 24
24 -
 25
25 -
 26
26 -
 27
27 -
 28
28 -
 29
29 -
 30
30 -
 31
31 -
 32
32 -
 33
33 -
 34
34 -
 35
35 -
 36
36 -
 37
37 -
 38
38 -
 39
39 -
40
-
41
-
42
-
43
-
44
-
45
-
46
-
47
-
48
-
49
-
50
-
51
-
52
-
53
-
54
-
55
-
56
-
57
 |
 |

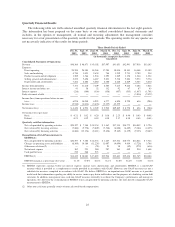
Quarterly Financial Results
The following table sets forth selected unaudited quarterly financial information for the last eight quarters.
This information has been prepared on the same basis as our audited consolidated financial statements and
includes, in the opinion of management, all normal and recurring adjustments that management considers
necessary for a fair presentation of the quarterly results for the periods. The operating results for any quarter are
not necessarily indicative of the results for future periods.
Three Month Periods Ended
Dec. 31,
2003
Sept. 30,
2003
June 30,
2003
March 31,
2003
Dec. 31,
2002
Sept. 30,
2002
June 30,
2002
March 31,
2002
(in thousands, except per share data)
(unaudited)
Consolidated Statements of Operations:
Revenue................................. $46,366 $ 48,671 $ 43,102 $37,997 $41,651 $42,941 $37,918 $33,165
Expenses:
Direct operating ......................... 20,590 20,384 18,568 17,284 18,010 18,141 16,448 15,189
Sales and marketing ..................... 4,730 3,051 2,634 704 3,239 2,711 2,789 534
Product research and development .......... 1,389 1,566 1,524 1,293 1,249 1,170 1,344 1,234
Selling, general and administrative .......... 5,222 5,658 6,487 5,833 5,510 5,284 5,572 5,774
Depreciation and amortization ............. 7,282 6,802 6,680 6,380 6,428 6,409 6,363 6,610
Income from operations ..................... 7,153 11,210 7,209 6,503 7,215 9,226 5,402 3,824
Interest income and other, net ................ 41 38 52 132 92 67 87 63
Interest expense ........................... (216) (300) (336) (358) (457) (535) (1,017) (1,701)
Early retirement of debt ..................... — — — — — — (3,836) (2,472)
Income (loss) from operations before income
taxes.................................. 6,978 10,948 6,925 6,277 6,850 8,758 636 (286)
Incometaxes ............................. (2,548) (4,014) (2,676) (2,335) 42,555 — — —
Netincome(loss) ......................... $ 4,430 $ 6,934 $ 4,249 $ 3,942 $49,405 $ 8,758 $ 636 $ (286)
Net income (loss) per share:
Basic ................................. $ 0.21 $ 0.32 $ 0.20 $ 0.18 $ 2.25 $ 0.40 $ 0.03 $ (0.01)
Diluted................................ 0.21 0.32 0.19 0.18 2.17 0.38 0.03 (0.01)
Quarterly cash flow information:
Net cash provided by operating activities ..... $20,397 $ 7,304 $ 24,334 $ 1,467 $17,334 $10,775 $16,842 $ 5,726
Net cash used by investing activities ......... (7,680) (5,770) (5,009) (7,540) (6,088) (6,485) (5,104) (4,435)
Net cash used by financing activities ........ (4,600) (13,176) (8,411) (5,420) (9,145) (4,179) (9,133) (9,487)
Reconciliation of GAAP measurement to
EBITDA(1):
Net cash provided by operating activities ..... $20,397 $ 7,304 $ 24,334 $ 1,467 $17,334 $10,775 $16,842 $ 5,726
Changes in operating assets and liabilities .... (6,369) 10,186 (11,224) 11,097 (4,094) 4,434 (5,728) 3,706
Other non-cash items(2) .................. — — (28) 93 38 (42) (279) (636)
Net interest expense ..................... 182 251 280 287 363 449 930 1,608
Cashpaidfortaxes ...................... 232 260 523 — — — — —
EBITDA(1) ............................ $14,442 $ 18,001 $ 13,885 $12,944 $13,641 $15,616 $11,765 $10,404
EBITDA margin as a percentage of revenue . . 31.1% 37.0% 32.2% 34.1% 32.8% 36.4% 31.0% 31.4%
(1) EBITDA represents earnings before net interest expense, income taxes, depreciation, and amortization. EBITDA is a non-GAAP
measure which is provided as a complement to results provided in accordance with GAAP. However, non-GAAP measures are not a
substitute for measures computed in accordance with GAAP. We believe EBITDA is an important non-GAAP measure as it provides
useful cash flow information regarding our ability to service, incur or pay down indebtedness and for purposes of calculating certain debt
covenants. In addition, management uses such non-GAAP measures internally to evaluate the Company’s performance and manage its
operations. See above for the reconciliation of EBITDA to net cash provided by operating activities, the most directly comparable GAAP
measurement to EBITDA.
(2) Other non-cash items generally consist of non-cash stock-based compensation.
25