Redbox 2003 Annual Report Download - page 19
Download and view the complete annual report
Please find page 19 of the 2003 Redbox annual report below. You can navigate through the pages in the report by either clicking on the pages listed below, or by using the keyword search tool below to find specific information within the annual report.-
 1
1 -
2
-
3
-
4
-
5
-
6
-
7
-
8
-
 9
9 -
 10
10 -
 11
11 -
 12
12 -
 13
13 -
 14
14 -
 15
15 -
 16
16 -
 17
17 -
 18
18 -
 19
19 -
 20
20 -
 21
21 -
 22
22 -
 23
23 -
 24
24 -
 25
25 -
 26
26 -
 27
27 -
 28
28 -
 29
29 -
30
-
31
-
32
-
33
-
34
-
35
-
36
-
37
-
38
-
39
-
40
-
41
-
42
-
43
-
44
-
45
-
46
-
47
-
48
-
49
-
50
-
51
-
52
-
53
-
54
-
55
-
56
-
57
 |
 |

Year Ended December 31,
2003 2002 2001 2000 1999
(in thousands, except per share, per unit data and where
noted)
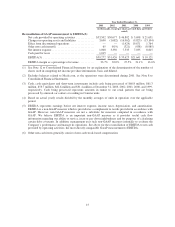
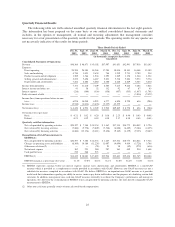
Reconciliation of GAAP measurement to EBITDA(5):
Net cash provided by operating activities ............. $53,502 $50,677 $ 46,802 $ 5,698 $ 21,631
Changes in operating assets and liabilities ............ 3,690 (1,682) (16,962) (9,825) (13,104)
Effect from discontinued operations ................. — — (1,429) 19,671 1,764
Other non-cash items(6) .......................... 65 (919) (321) (938) (8,985)
Net interest expense .............................. 1,000 3,350 7,535 7,035 8,815
Cashpaidfortaxes .............................. 1,015 — — — —
EBITDA(5) .................................... $59,272 $51,426 $ 35,625 $21,641 $ 10,121
EBITDA margin as a percentage of revenue ........... 33.7% 33.0% 27.5% 21.1% 13.0%
(1) See Note 12 to Consolidated Financial Statements for an explanation of the determination of the number of
shares used in computing net income per share information, basic and diluted.
(2) Excludes balances related to Meals.com, as the operations were discontinued during 2001. See Note 8 to
Consolidated Financial Statements.
(3) Cash, cash equivalents and short-term investments include cash being processed of $60.8 million, $61.3
million, $53.7 million, $42.6 million and $31.4 million at December 31, 2003, 2002, 2001, 2000, and 1999,
respectively. Cash being processed represents amounts in transit to our retail partners that are being
processed by armored car carriers or residing in Coinstar units.
(4) Based on actual yearly results divided by the monthly averages of units in operation over the applicable
period.
(5) EBITDA represents earnings before net interest expense, income taxes, depreciation, and amortization.
EBITDA is a non-GAAP measure which is provided as a complement to results provided in accordance with
GAAP. However, non-GAAP measures are not a substitute for measures computed in accordance with
GAAP. We believe EBITDA is an important non-GAAP measure as it provides useful cash flow
information regarding our ability to service, incur or pay down indebtedness and for purposes of calculating
certain debt covenants. In addition, management uses such non-GAAP measures internally to evaluate the
Company’s performance and manage its operations. See above for the reconciliation of EBITDA to net cash
provided by operating activities, the most directly comparable GAAP measurement to EBITDA.
(6) Other non-cash items generally consist of non-cash stock-based compensation.
15