Redbox 2003 Annual Report Download - page 18
Download and view the complete annual report
Please find page 18 of the 2003 Redbox annual report below. You can navigate through the pages in the report by either clicking on the pages listed below, or by using the keyword search tool below to find specific information within the annual report.-
 1
1 -
2
-
3
-
4
-
5
-
6
-
7
-
 8
8 -
 9
9 -
 10
10 -
 11
11 -
 12
12 -
 13
13 -
 14
14 -
 15
15 -
 16
16 -
 17
17 -
 18
18 -
 19
19 -
 20
20 -
 21
21 -
 22
22 -
 23
23 -
 24
24 -
 25
25 -
 26
26 -
 27
27 -
 28
28 -
29
-
30
-
31
-
32
-
33
-
34
-
35
-
36
-
37
-
38
-
39
-
40
-
41
-
42
-
43
-
44
-
45
-
46
-
47
-
48
-
49
-
50
-
51
-
52
-
53
-
54
-
55
-
56
-
57
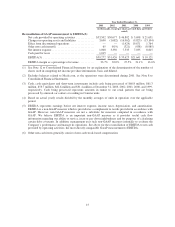
 |
 |

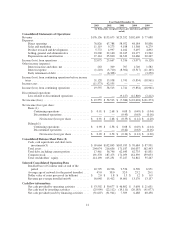
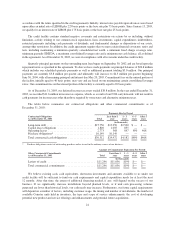
Year Ended December 31,
2003 2002 2001 2000 1999
(in thousands, except per share, per unit data and where
noted)
Consolidated Statements of Operations:
Revenue ....................................... $176,136 $155,675 $129,352 $102,609 $ 77,688
Expenses:
Direct operating ............................. 76,826 67,788 58,072 48,184 38,836
Sales and marketing .......................... 11,119 9,273 9,188 11,368 6,279
Product research and development ............... 5,772 4,997 4,162 3,497 4,892
Selling, general and administrative .............. 23,200 22,140 22,245 18,177 13,542
Depreciation and amortization .................. 27,144 25,810 26,349 24,460 20,267
Income (loss) from operations ...................... 32,075 25,667 9,336 (3,077) (6,128)
Other income (expense):
Interest income and other, net .................. 263 309 707 1,740 1,582
Interest expense ............................. (1,210) (3,710) (8,302) (8,517) (11,165)
Early retirement of debt ....................... — (6,308) — — (3,250)
Income (loss) from continuing operations before income
taxes ........................................ 31,128 15,958 1,741 (9,854) (18,961)
Incometaxes.................................... (11,573) 42,555 — — —
Income (loss) from continuing operations ............. 19,555 58,513 1,741 (9,854) (18,961)
Discontinued operations:
Loss related to discontinued operations ........... — — (9,127) (12,840) (2,412)
Netincome(loss) ................................ $ 19,555 $ 58,513 $ (7,386) $ (22,694) $ (21,373)
Net income (loss) per share:
Basic:(1)
Continuing operations .................... $ 0.91 $ 2.68 $ 0.08 $ (0.49) $ (1.04)
Discontinued operations ................... — — (0.43) (0.63) (0.16)
Netincome(loss)pershare ............ $ 0.91 $ 2.68 $ (0.35) $ (1.12) $ (1.20)
Diluted:(1)
Continuing operations .................... $ 0.90 $ 2.58 $ 0.08 $ (0.49) $ (1.04)
Discontinued operations .................. — — (0.42) (0.63) (0.16)
Netincome(loss)pershare ............ $ 0.90 $ 2.58 $ (0.34) $ (1.12) $ (1.20)
Consolidated Balance Sheet Data:(2)
Cash, cash equivalents and short-term
investments(3) ............................ $ 99,664 $102,843 $105,935 $ 70,684 $ 87,991
Total assets ................................. 204,074 216,636 171,187 156,037 162,443
Total debt, including current portion ............. 17,461 36,746 62,643 62,735 61,831
Commonstock .............................. 191,370 187,473 171,059 161,339 159,053
Total stockholders’ equity. ..................... 114,190 105,251 37,227 34,842 55,267
Selected Consolidated Operating Data
Installed base of Coinstar units at end of the
period ................................... 10,795 10,706 9,576 8,509 6,951
Average age of network for the period (months) .... 45.0 38.0 32.0 25.2 20.1
Dollar value of coins processed (in billions) ....... $ 2.0 $ 1.8 $ 1.5 $ 1.2 $ 0.9
Revenue per average installed unit(4) ............ 16,048 15,412 14,601 13,170 13,137
Cash flow information:
Net cash provided by operating activities ......... $ 53,502 $ 50,677 $ 46,802 $ 5,698 $ 21,631
Net cash used by investing activities ............. (25,999) (22,112) (19,111) (20,185) (41,077)
Net cash provided (used) by financing activities .... (31,607) (31,944) 7,509 6,488 60,458
14